Abstract
Background:
Comorbidity risk-adjustment tools are widely used in health database research to control for clinical differences between individuals, but they need to be validated a priori. This study aimed to identify the optimal parameters for predicting all-cause inhospital mortality using Quan’s enhanced Elixhauser comorbidity measures (ECMs) in the US-based Cerner Health Facts® (HF) electronic health record database.
Methods:
Health care recipients aged 18–89 years between 2002 and 2011 were included. Prevalent comorbidities recorded, 1) during the index encounter; 2) in the prior year; and 3) in the prior 2 years were identified using the ECMs. Multiple logistic regression models, with inhospital mortality at index and at 1 year as the predicted outcomes, were fitted with comorbidities summarized as binary indicators, total counts, or weighted scores for the three look back periods. Baseline variables included sex and age. The receiver operating characteristic (ROC) curves of the competing models were compared with a non-parametric Mann–Whitney U test to identify the optimal parameters.
Results:
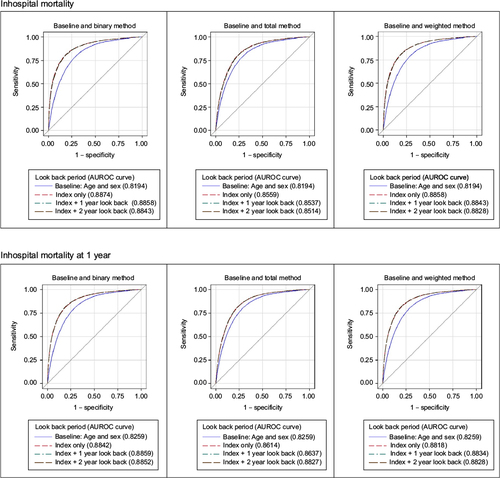
A sample of 3,273,298 unique health care recipients were included, of whom 31,298 (1.0%) and 50,215 (1.5%) died during the index encounter and within the 1-year follow-up, respectively. Models of comorbidity based on binary and weighted indicators had near-identical performance and were statistically better than the models based on total counts (p < 0.0001). Discrimination of inhospital mortality was highest with a look back period limited to the index encounter, while inhospital mortality at 1 year was best predicted with 1 year of look back (p < 0.0001).
Conclusion:
In Cerner HF, the binary and weighted methods for summarizing the Quan ECM were the best predictors of all-cause inhospital mortality at index and at 1 year. Observed differences in predictive performance between models with diagnostic ascertainment periods of up to 2 years of look back were statistically significant but not practically important.
Acknowledgments
This study was supported by the Fonds de recherche du Québec – Santé (FRQS), the McLaughlin Centre for Population Health Risk Assessment, and the University of Ottawa’s admission and excellence scholarship programs. The authors would like to thank the Cerner Corporation for generously allowing their team to conduct research using the HF database. They also want to acknowledge the journal reviewers for their valuable comments and suggestions.
Disclosure
YF, JAGC, and DC report no competing interests. DSM is the president of Cerner Math Inc. and has ownership interest in the Cerner Corporation. This paper reflects the opinions of the authors and not necessarily those of the Canadian Institute for Health Information or the Cerner Corporation. DRM serves as chief medical officer of Risk Sciences International (RSI), a company formed in partnership with the University of Ottawa in 2006. RSI undertakes risk assessment work for public and private sector clients in Canada and abroad. RSI has not conducted prior work on the subject of the present research paper. DK is chief risk scientist and CEO of RSI. Since 2002, DK has held a Natural Sciences and Engineering Research Council of Canada (NSERC) Industrial Research Chair in Risk Science, through a peer-reviewed university–industry partnerships program administered by NSERC. The scientific opinions and conclusions expressed in research publications by the chair are the responsibility of the chair alone. The authors report no other conflicts of interest in this work.
Supplementary materials
Figure S1 Comparisons of ROC curves across comorbidity summary methods by mortality outcome and look back period.
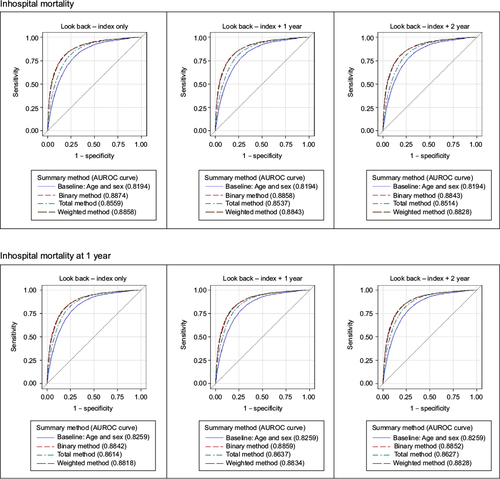
Figure S2 Comparisons of ROC curves across look back periods by mortality outcome and comorbidity summary method.