Figures & data
Figure 1. Multilevel inverter with a single-phase and 7 levels of suggested cascaded H-bridge.
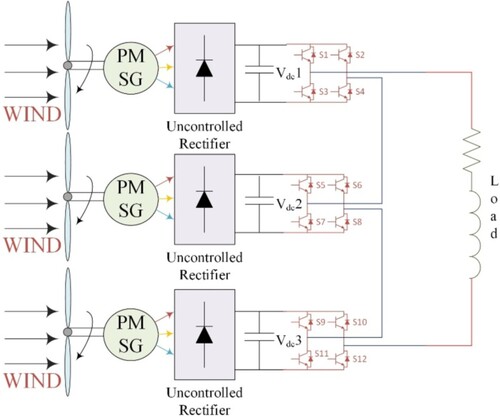
Figure 2. Seven-level cascaded H-multilevel bridge's inverter voltage outputs.
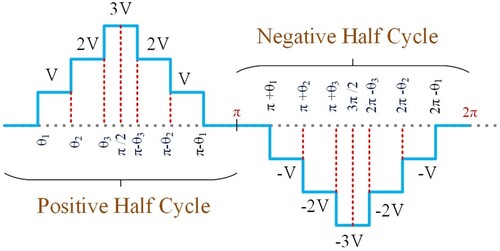
Table 1. GA specifications utilized in the simulation.
Figure 3. Diagrammatic flow of the PSO algorithm.
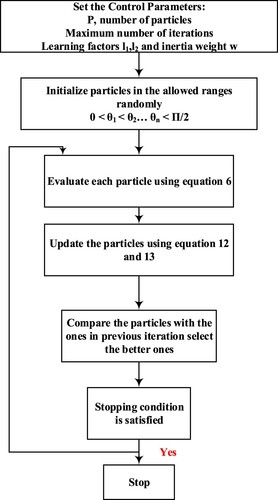
Figure 4. The diagrammatic flow of the SSA algorithm.
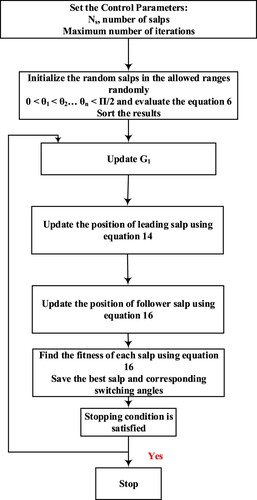
Table 2. Switching degree, modulation indices, and total harmonic mean values for 7-level cascaded H-bridge multilevel inverters.
Table 3. Switching degrees, modulation indices, as well as total harmonic estimates for a cascaded eleven-level H-bridge multilevel inverters.
Table 4. Modulation indices, switching degrees, and total harmonic estimates for fifteen-level cascaded H-bridge multilevel inverters.
Figure 5. Total harmonic estimates and relatively closer optimal degrees determined with SSA for 7-, eleven-, and fifteen-level inverters.
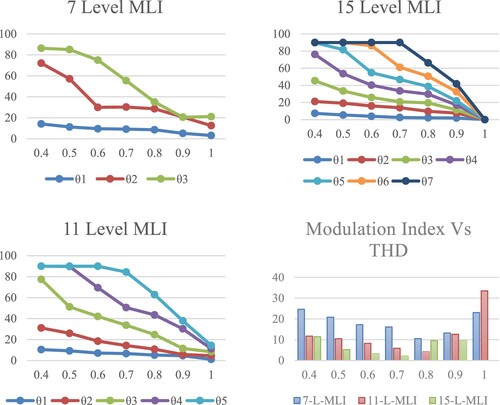
Figure 6. Total harmonic estimates and relatively closer optimal degrees determined with MNSGA-II for 7-, eleven-, and fifteen-level inverters.
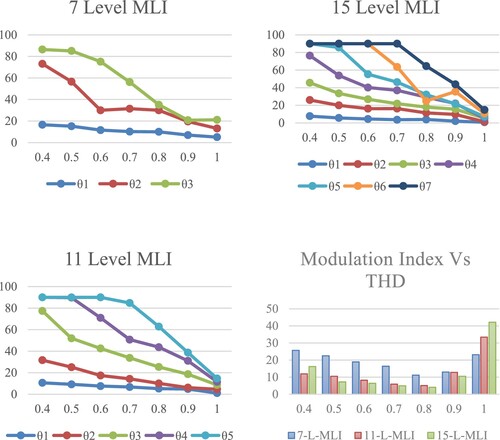
Figure 7. PSO yields relatively closer angles for 7-, eleven-, and fifteen-level inverters, as well as total harmonic estimates.
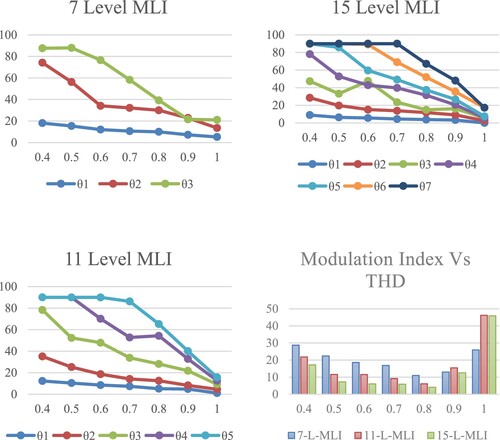
Figure 8. GA yields relatively closer angles for 7-, eleven-, and fifteen-level inverters, as well as total harmonic estimates.
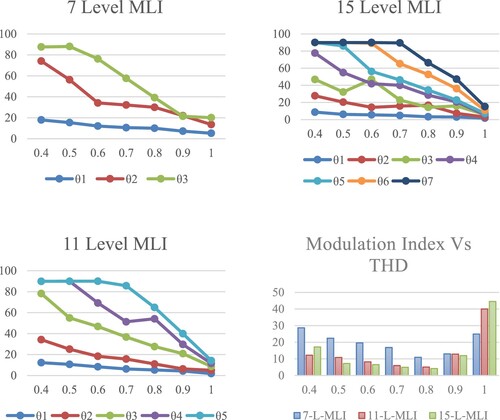
Figure 9. Magnitudes of voltage measured at m = 0.8.
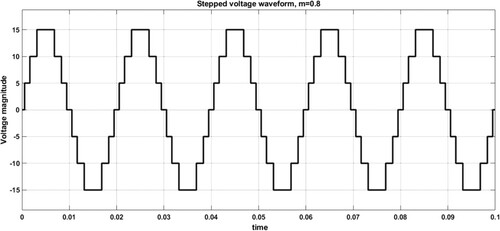
Figure 10. Magnitudes of voltage measured at m = 0.7.
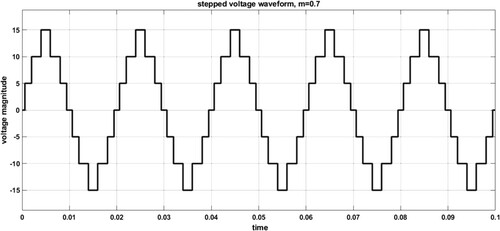
Figure 11. Using the simulation results, derived total harmonic values at m = 0.7.
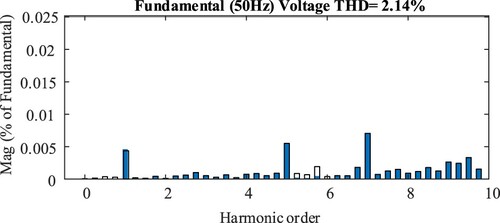
Figure 12. Using the simulation results, derived total harmonic findings at m = 0.8.

Figure 13. Research's general schematic representation.
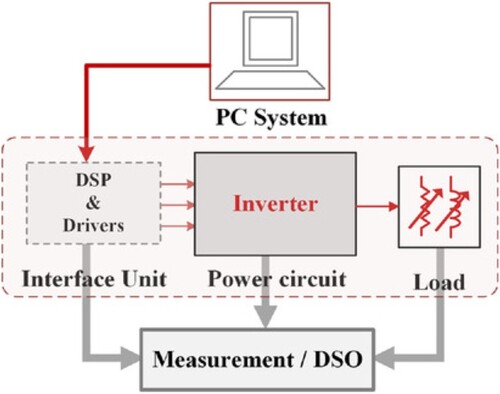
Table 5. Experimental testing specifications.
Figure 14. Experimental setup for laboratory investigations.
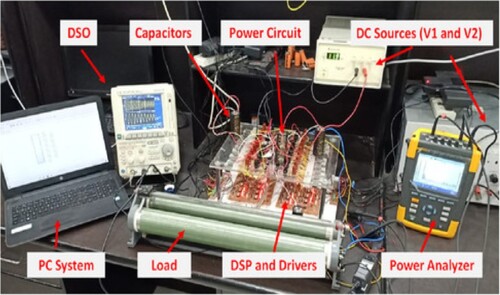
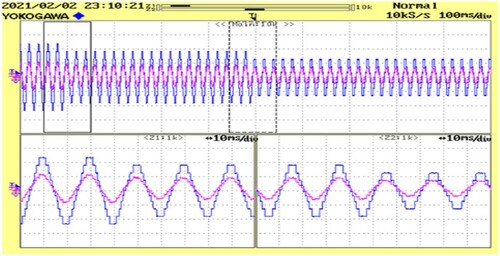
Figure 15. Voltage and current for constant R load.
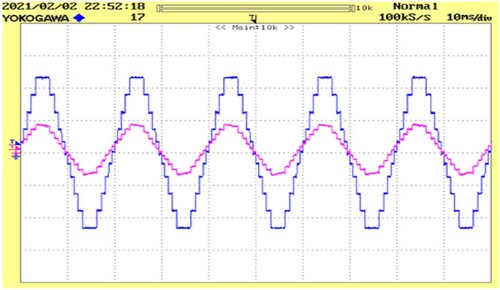
Figure 16. Voltage and current for constant RL load.
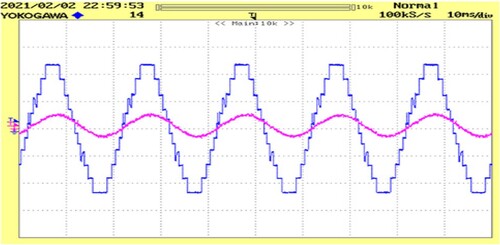
Figure 17. Voltage and current for changing R load.
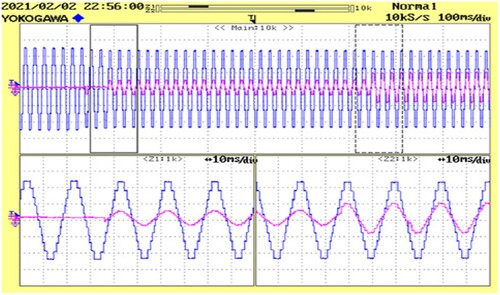
Figure 18. Voltage and current for changing modulation index.