Figures & data
Figure 1. Six-phase VSI traction inverter topology.
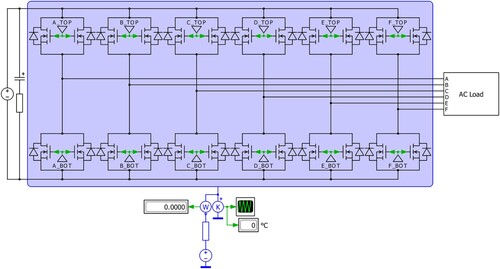
Figure 2. Six-phase T-NPC traction inverter topology.
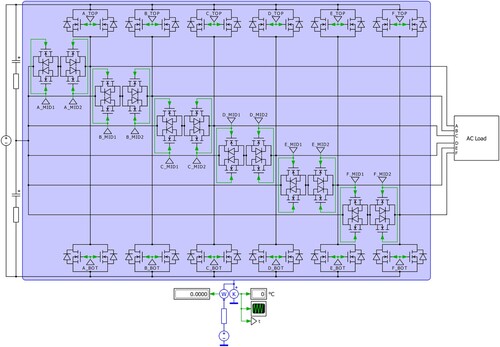
Figure 3. Sinusoidal PWM control system for six-phase VSI inverter.
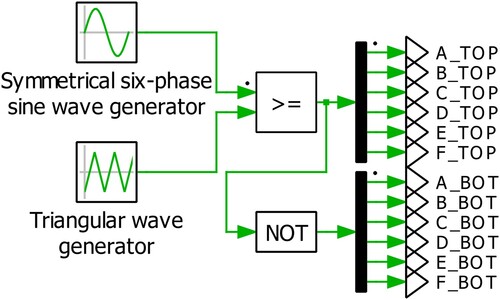
Figure 4. Sinusoidal PWM control system for six-phase T-NPC inverter.
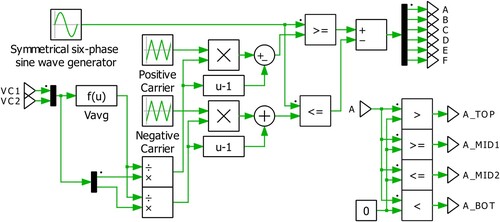
Figure 5. Sinusoidal PWM driving signals for A-leg of VSI traction inverter.
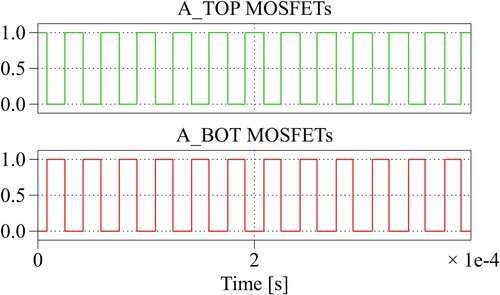
Figure 6. Sinusoidal PWM driving signals for A-leg of T-NPC traction inverter.
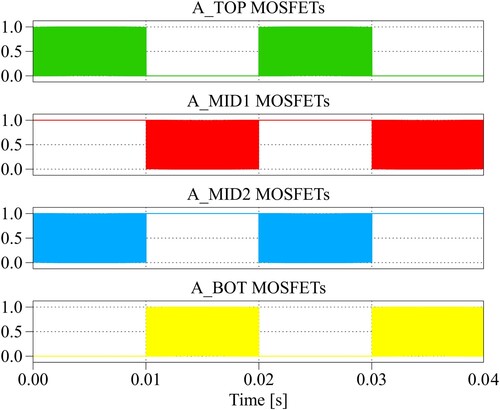
Figure 7. Turn-on loss energy of NTBG015N065SC1 in PLECS thermal domain.
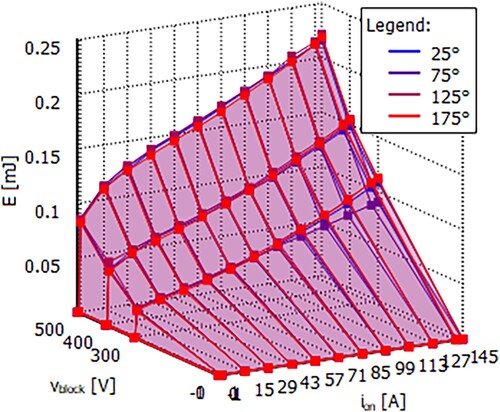
Figure 8. Turn-off loss energy of NTBG015N065SC1 in PLECS thermal domain.
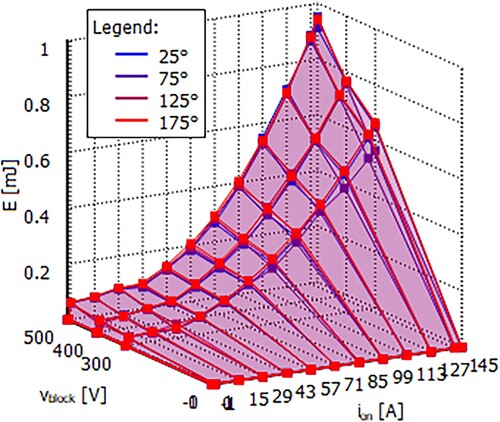
Figure 9. Forward characteristic of NTBG015N065SC1 in PLECS thermal domain.
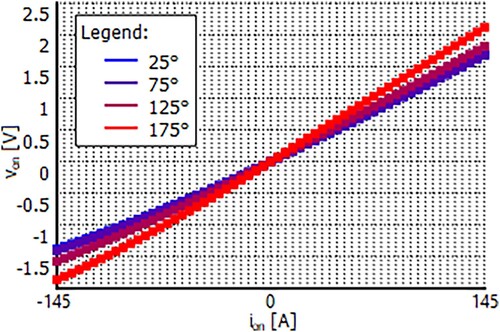
Figure 10. Power losses calculation block with its settings.
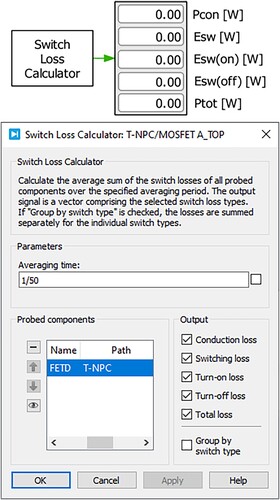
Table 1. Input parameters.
Figure 11. VSI traction inverter line-to-neutral voltages at 50 kW output power.
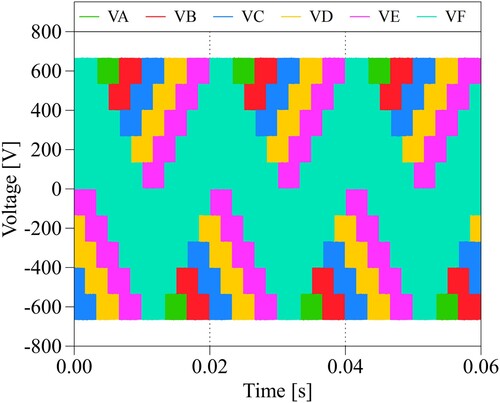
Figure 12. VSI traction inverter line-to-line voltages at 50 kW output power.
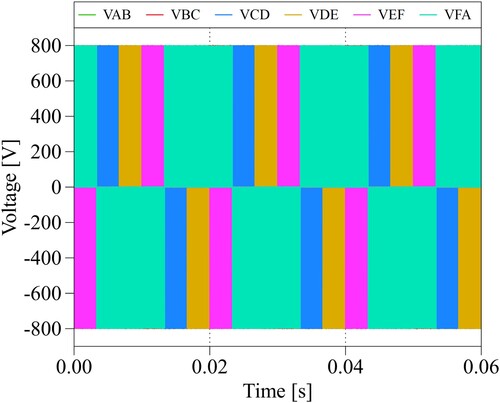
Figure 13. VSI traction inverter phase currents at 50 kW output power.
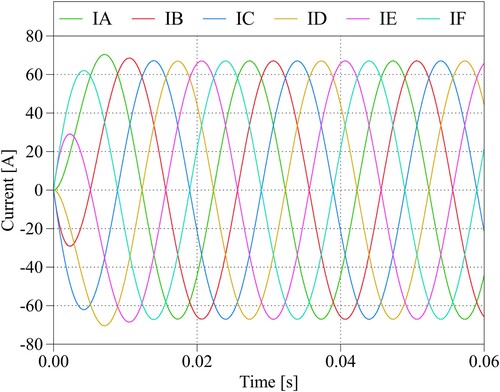
Figure 14. T-NPC traction inverter line-to-neutral voltages at 50 kW output power.
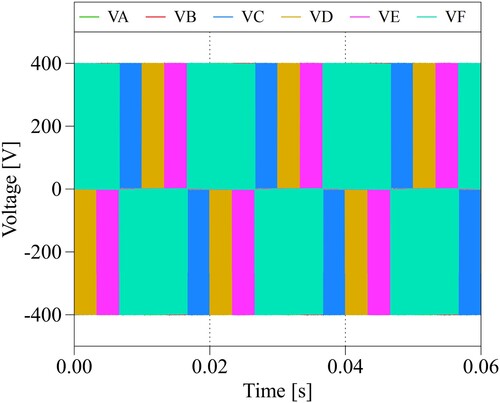
Figure 15. T-NPC traction inverter line-to-line voltages at 50 kW output power.
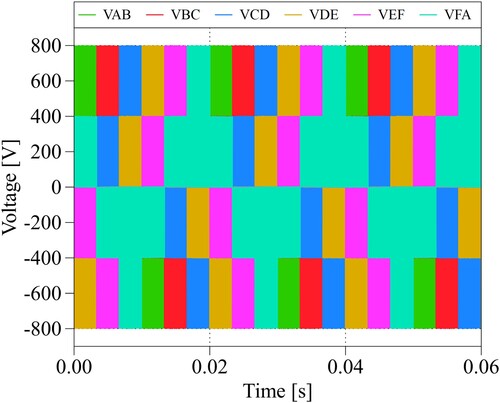
Figure 16. T-NPC traction inverter output currents at 50 kW output power.
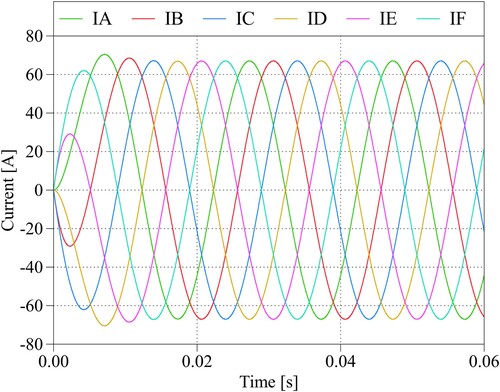
Figure 17. Voltages on the VSI inverter A-leg MOSFETs at all power levels.
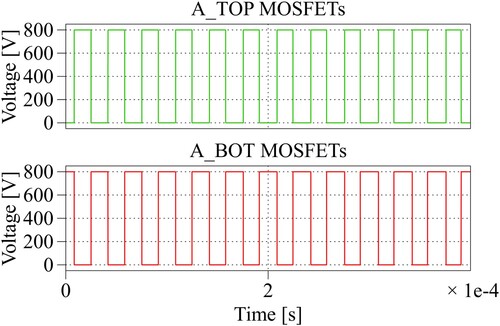
Figure 18. Voltages on the T-NPC inverter A-leg MOSFETs at all power levels.
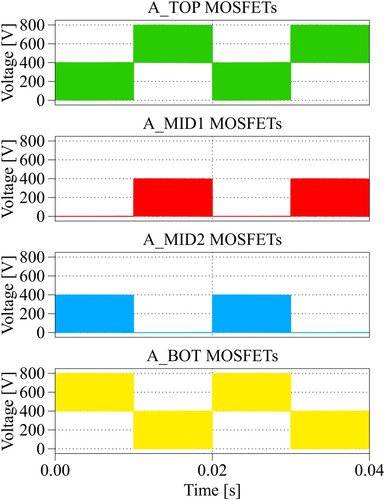
Table 2. Range of the effective values of A-leg MOSFETs voltages in both traction inverter topologies.
Figure 19. Currents of the VSI inverter A-leg MOSFETs at 100 kW output power.
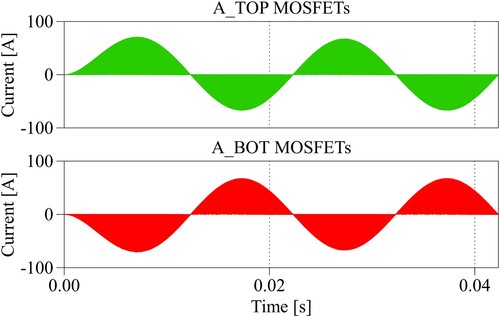
Figure 20. Currents of the T-NPC inverter A-leg MOSFETs at 100 kW output power.
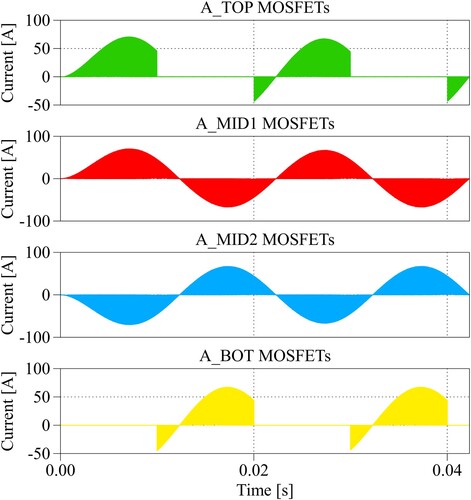
Table 3. Range of the effective values of A-leg MOSFETs currents in both traction inverter topologies.
Figure 21. Total power losses analysis of the VSI traction inverter.
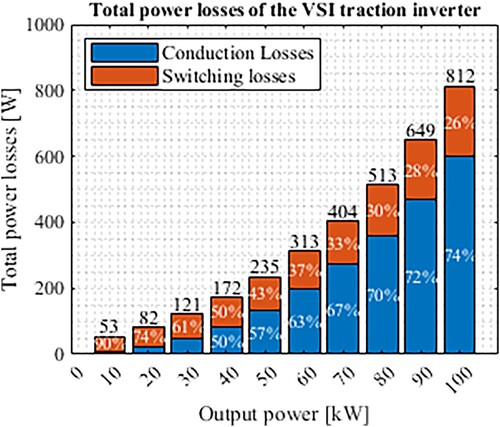
Figure 22. Total power losses analysis of the T-NPC traction inverter.
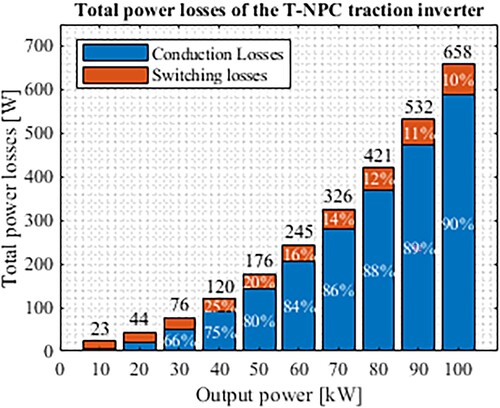
Figure 23. Switching power losses analysis of the VSI traction inverter.
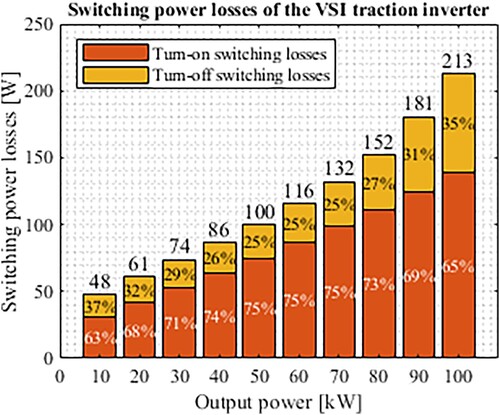
Figure 24. Switching power losses analysis of the T-NPC traction inverter.
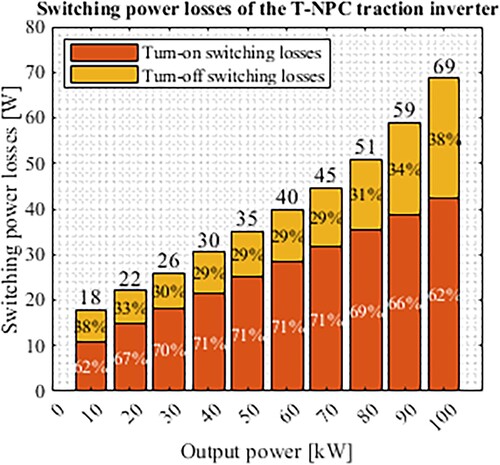
Figure 25. VSI inverters A-leg total power losses.
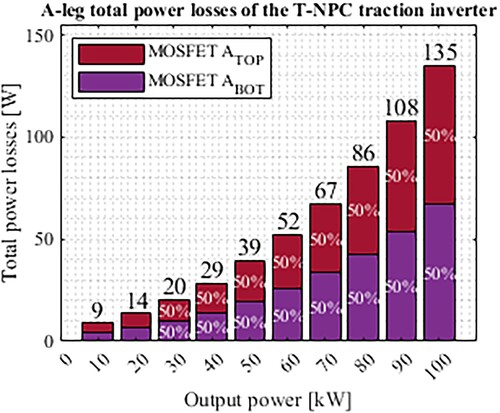
Figure 26. T-NPC inverters A-leg total power losses.
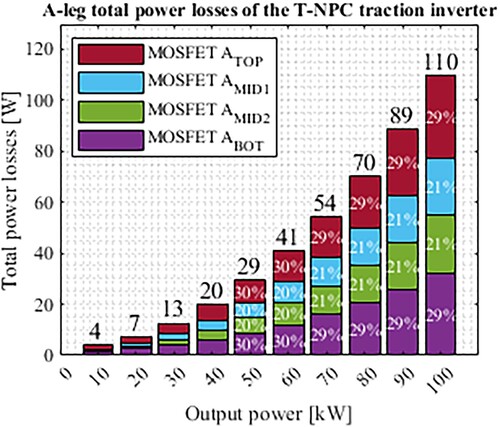
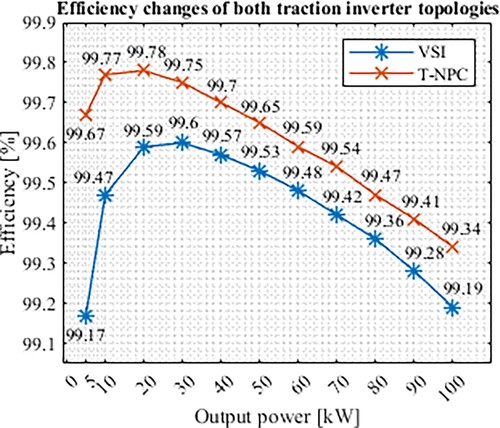
Figure 27. Efficiency evaluation of both analyzed traction inverter topologies.