
Figures & data
Figure 1. A conceptual framework for investigating moderation effects of professional development.
Note: This figure is a reproduction of from Dong et al. (Citation2023a).
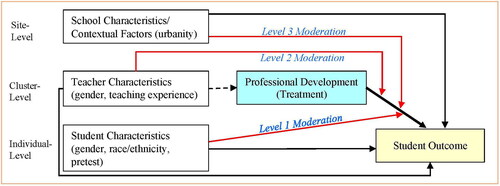
Table 1. Summary of statistical models for the moderation analysis in two-level MIRTs and three-level MCRTs.
Table 2. List of design options and software modules.
Figure 2. An example of MDESD calculation for binary moderators at level-1, -2, and -3 with random effects in three-level MCRT.
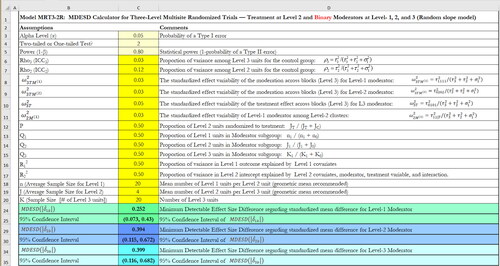
Figure 3. An example of power calculation for binary moderators at level-1, -2, and -3 with random effects in three-level MCRT.
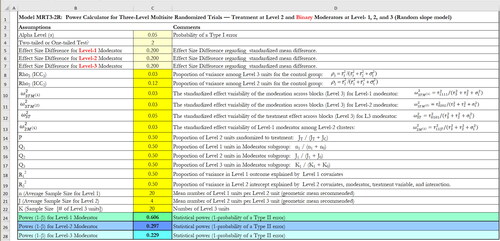
Table 3. MDESD and statistical power of three-level MCRTs.
Figure 4. An example of power calculation for binary moderators at level-1 and -2 with random effects in two-level MIRTs.
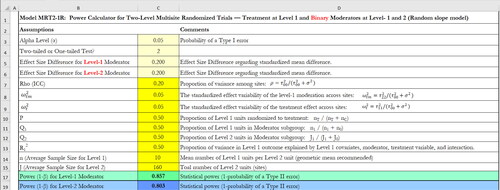
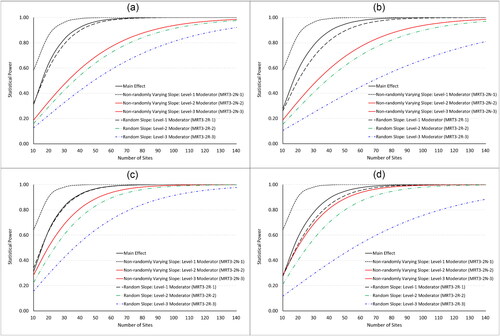
Figure 5. Power vs. site sample size for the analysis of main effects and binary moderator effects in three-level MCRTs.
Note. Under the assumptions: n = 20, J = 4, P = 0.5, =
= 0.5,
=
=
= 0.5, effect size (standardized mean difference) for main effects = 0.2, effect size difference for binary moderator effects = 0.2, and a two-sided test with α = 0.05.
=0.03,
=0.12,
=
= 0.03, and
= 0.05 for random slope designs in .
=0.03,
=0.12,
=
= 0.05, and
= 0.10 for random slope designs in .
=0.20,
=0.06,
=
= 0.03, and
= 0.05 for random slope designs in .
=0.20,
=0.06,
=
= 0.05, and
= 0.10 for random slope designs in .
Table
Table