
Figures & data
Table 1. Background data of the participants included in the analysis.
Figure 1. Spot the relations card deck.
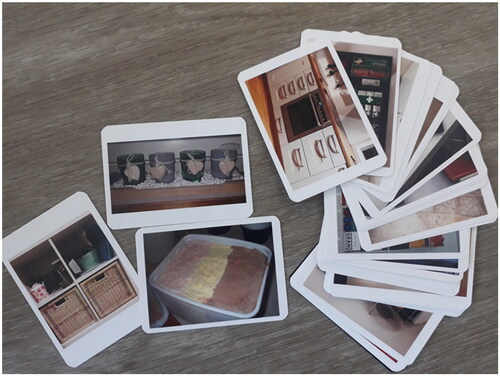
Figure 2. Scavenger hunt sheet used in lesson 3 (translated). Note. The first five tasks were to be found in the classroom, followed by 13 similar tasks from within the entire school.
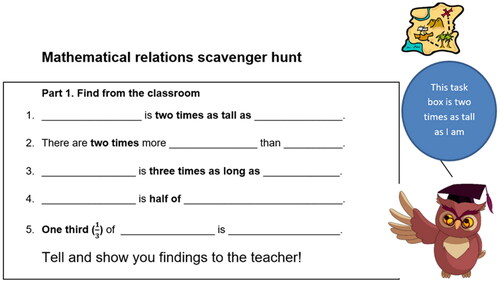
Figure 3. Home work sheet handed to the students at the end of the third lesson (translated).
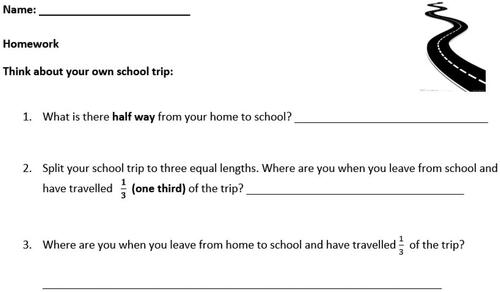
Figure 4. Screenshots of the gameplay tasks.
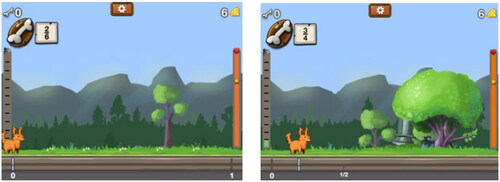
Table 2. Structure and content of the game levels.
Table 3. Adaptation of the required estimation accuracy.
Figure 5. SFOR tendency task items. Note. Copyrights of the photos: first author (pretest item 3 and posttest items 1 and 3), last author (pretest items 1 and 2 and posttest item 2), and fourth author (pretest item 4 and posttest item 4)
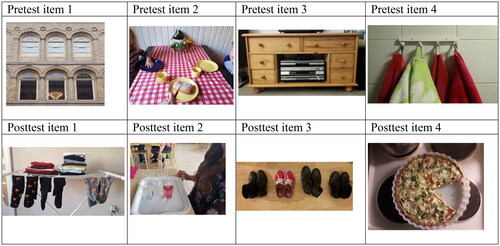
Figure 6. Multiplicative relations task items. Note. Copyrights of the photos: second author (pretest item 3), Andrey Khronelok/BigStockPhoto (pretest and posttest item 4), and last author (posttest item 3).
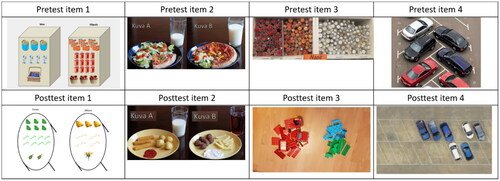
Table 4. Means, standard deviations (in parentheses), percent of students with at least one point on the task (%), Cronbach’s alphas, and intraclass correlations (ICCs) of the three knowledge measures in the pre- and posttests for the spot the relations and fraction estimation game groups.
Table 5. −2 Restricted logarithmic likelihood scores of the two models.
Figure 7. Means of the picture description task scores on the pre- and posttests for the spot the relations and fraction estimation game groups. Note. Error bars represent the plus/minus standard errors for the means.
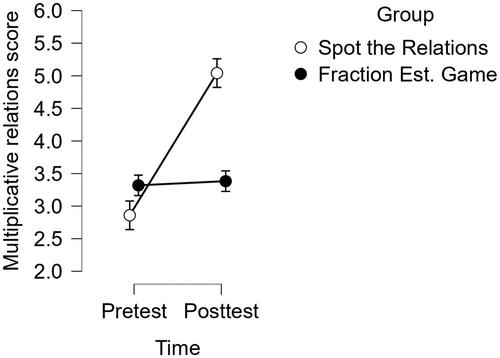
Figure 8. Means of the fraction knowledge task scores (standardized) on the pre- and posttests for the spot the relations and fraction estimation game groups. Note. Error bars represent the plus/minus standard errors for the means.
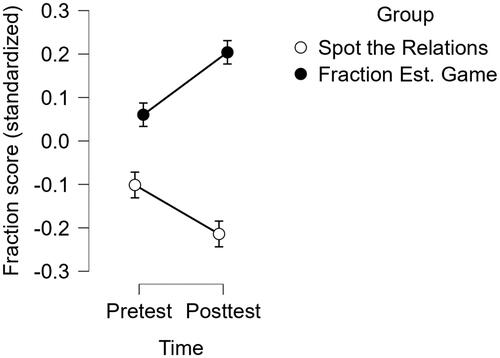
Figure 9. Means of the SFOR tendency task scores on the pre- and posttests for the spot the relations and fraction estimation game groups. Note. Error bars represent the plus/minus the standard errors of the means.
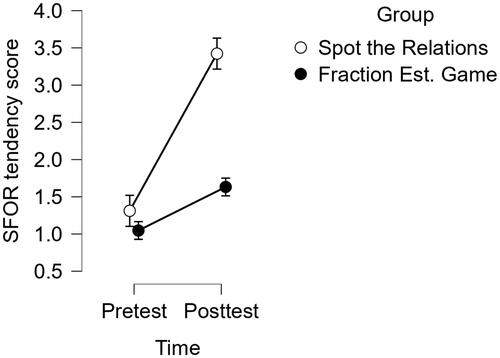
Table 6. Mean (standard deviations) of words used in the photo description (SFOR tendency) task items.