
Figures & data
Figure 1. Location maps and setting for the Otekaike Limestone in the Waitaki valley. A, Digital elevation model of topography (from Geographx. co.nz) of the study region. Inset shows the study region in relation to Otago Schist basement. B, Present exposures of limestones in the region (from Forsyth Citation2001), with the locations of study sites. C, Summary annual rainfall map for the region (adapted from NIWA Citation2023), showing the low-rainfall corridor down the Waitaki valley. D, Oblique view from southeast of the region, contoured for solar irradiation variations (from Solargis; http://globalsolaratlas.info), showing the corridor of high irradiation down the Waitaki valley.
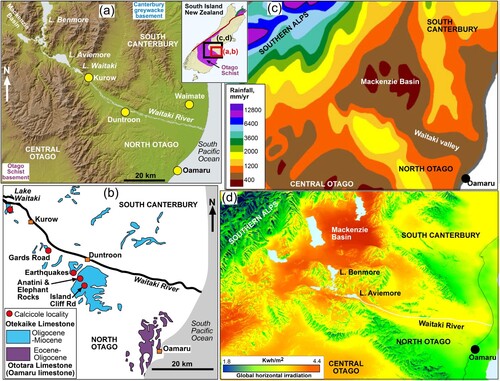
Figure 2. Structure and stratigraphy of the Otekaike Limestone in the Waitaki valley study region (localities in B). A, Sketch cross section through the Anatini site. B, Cliffs at Gards Road site, showing topographic and outcrop distinctions between calcite-rich limestone (bottom) and sand and silt rich limestone (top). C, Sketch cross section through the limestone locality near Lake Waitaki. Legend as in 2a. D, Outcrop appearance with variable sand contents at Lake Waitaki site. E, Lower part of limestone cliff at the Earthquakes site, showing a rare exposure of underlying Kokoamu Greensand.
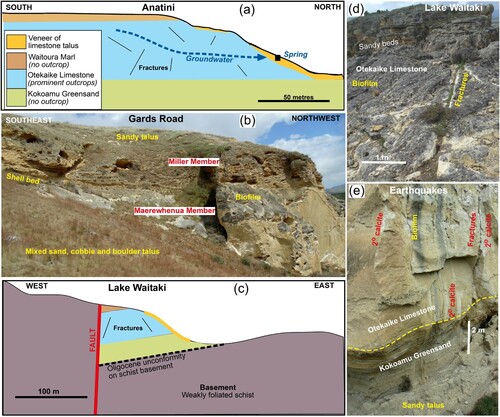
Table 1. Summary of some international observations on substrate chemistry adaptations by calcicoles that facilitate their establishment at the expense of other plants.
Figure 3. Outcrop appearances of Otekaike Limestone. A, Glaucony (dark) and calcite (pale) in greensand in transition to the base of Otekaike Limestone at the Earthquakes site (D). Inset summarises glaucony mineralogy. B, Backscatter electron image (BEI) of outcrop limestone from the Anatini site, showing the interior textures and mineralogy of the limestone dominated by calcite shell material (Cc) coated with cement which is mainly 2° calcite with traces of Mg, Al, Si, S and P. C, BEI view of limestone cement with P-rich glaucony. D, BEI view of a section through the outer margin of outcrop limestone from the Anatini site, with biofilm (right, dark) showing textural zonation. E, EDS element maps of the indicated area in e, showing relative distributions of Si, Mg Fe, and Al. Brighter patches in each map are well-defined mineral grains; paler zones are indications of dispersed elemental concentrations near to background levels (∼0.5 wt%).
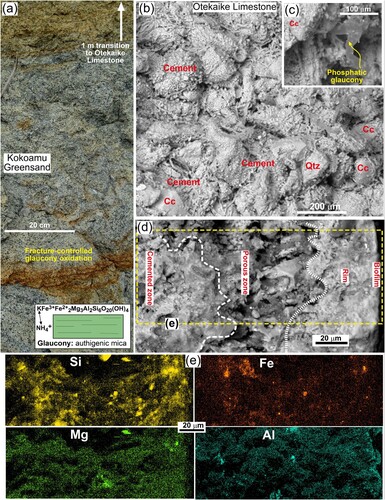
Figure 4. Samples of calcicole substrates, with paste pH (blue) and generalised electrical conductivity values (EC, red, µS/cm). A, Samples of disaggregated limestone obtained in the vicinity of calcicoles (Chaerophyllum) at the Anatini site. Samples are arranged in order of increasing organic content and decreasing general particle size, from clean limestone chips (top left) to proto-soil (bottom). Whitest patches on chips are secondary calcite. B, Naturally eroded section through disaggregated limestone substrate in vicinity of samples in 4A. C, Calcicole patch (Geranium socolateum) in a broad fracture-controlled solution cavity at the Elephant Rocks site. D, Sample of organic-rich turf with sandy limestone debris obtained from below exotic plants near native calcicoles in 4C.
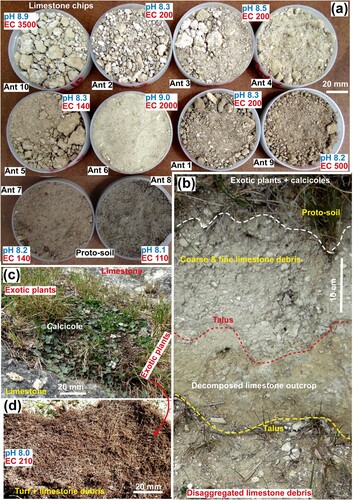
Figure 5. SEM views of disaggregated limestone chips from the Anatini site (A). A, BEI view of chip surface showing the textural contrasts between remnants of cemented limestone and intervening zones where calcite dissolution has left porous residues. B, Close view of porous residue material, showing detrital quartz (Qtz), albite (Ab) and muscovite (Musc), and a large grain of apatite. C, EDS P element map showing scattered fine phosphatic material (bright, in white ellipses) and one bright grain of apatite. More dispersed P-enriched areas also occur, with variable slightly brighter patches near to the analytical detection limit (∼0.5 wt%). D, BEI view of fully calcified plant rootlets (possibly Chaerophyllum) and intervening needles of calcite (see also Supplementary Figures 4 and 5).
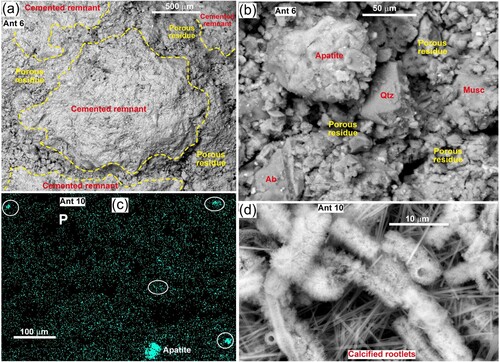
Figure 6. Calcicole microhabitats in solution cavities on limestone outcrop surfaces at the Anatini site. Grey-black surfaces represent variable thicknesses of biofilm coating limestone. A, Honeycomb weathering cavities on the vertical side of a large boulder, with Geranium socolateum calcicole. B, Flat outcrop surface with cavity that is partially filled with debris (hosting Chaerophyllum novae-zelandiae calcicoles), after wind and rain erosion has removed the upper debris layer, exposing white limestone surface. Inset shows enlarged view of calcicole microhabitat on porous limestone and debris. C, Chaerophyllum calcicoles in partially filled cavities, with an adjacent empty cavity. D, Elongate cavity is controlled by a steep fracture in outcrop and hosts Geranium and Chaerophyllum calcicoles.
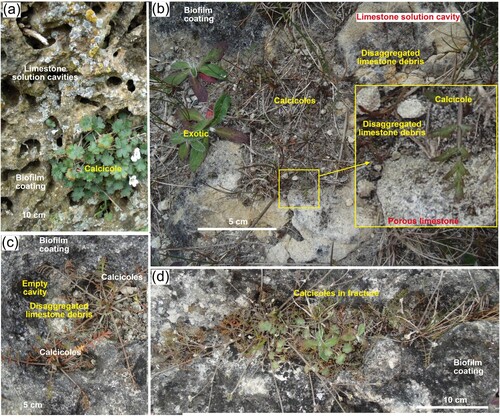
Figure 7. Calcicole microhabitats on top and bottom of limestone outcrops. A, Thin debris on top of outcrop at the Earthquakes site hosts mainly exotic species with minor calcicole establishment along the debris edge. Inset shows calcicoles (Geranium) with hawkweed. B, Calcicoles (Chaerophyllum basicola) and exotic species in sandy debris on top of fractured sandy limestone at the Lake Waitaki site. C, Calcicole grass (Simplicia felix) with exotic grasses in fallen debris under an overhang at the base of an Island Cliffs limestone outcrop. D, Calcicoles (Geranium microphyllum) and exotic grass under an overhang at base of cliff at the Anatini site.
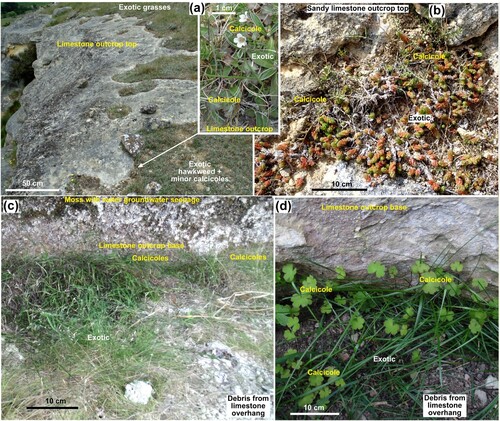
Figure 8. Calcicole (Chaerophyllum) microhabitats in limestone talus at the Anatini site. A, Bare and sparsely vegetated talus, locally with proto-soil, hosting scattered calcicoles. B, Calcicoles (arrowed) in bare soil-free coarse talus. C, Calcicoles (arrowed) in proto-soil with exotic plants in talus extending from the base of outcrop. D, E, Partially bare fine talus with calcicoles (arrowed) and scattered hawkweed.
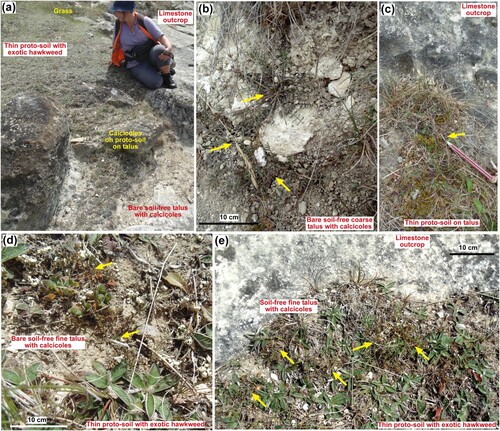
Figure 9. Calcicole microhabitats on soil-free talus associated with sandy limestone. A, Base of sandy limestone outcrop at the Gards Road, showing differential weathering of bedding, and formation of sandy talus below. B, Calcicoles (Chaerophyllum) and exotic plants in sandy talus at the Gards Road site. C, Sandy talus below outcrop at the Lake Waitaki site, with evaporative salts on surface in background, yielding localised high EC values. D, Calcicoles (Carmichaelia sp.) growing in sandy talus with limestone chips at the Lake Waitaki site.
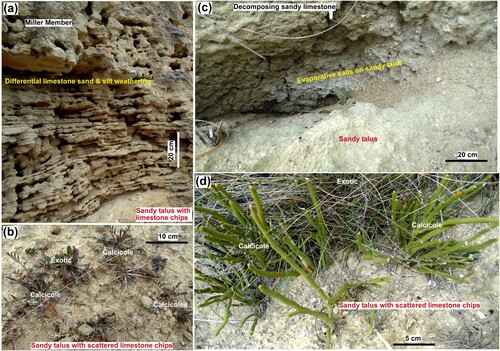
Figure 10. Paste pH, EC, and experimental moisture loss data for the samples in A,B. A, The pH variations with increasing organic content, for samples organised as in A,B. B, EC values for samples as in (A). C, Plot of pH versus EC for samples in A,B, compared to North Otago groundwater (Craw et al. Citation2022) and the Lake Waitaki site disaggregated limestone substrates (Rufaut et al. Citation2023). D, Summary of results of moisture retention experiment on substrates from the Anatini site (A). Labelled curves with daily measurements are for the substrate with most moisture loss (Ant 1), the least loss (Ant 6), and the most organic-rich proto-soil (Ant 8). Data for other substrates are listed in Supplementary Table 1. E, Comparison between moisture loss rates (for substrate Ant 1 in D) and number of consecutive rain-free days (droughts of indicated lengths) in 15-year period at Waimate (Supplementary ).
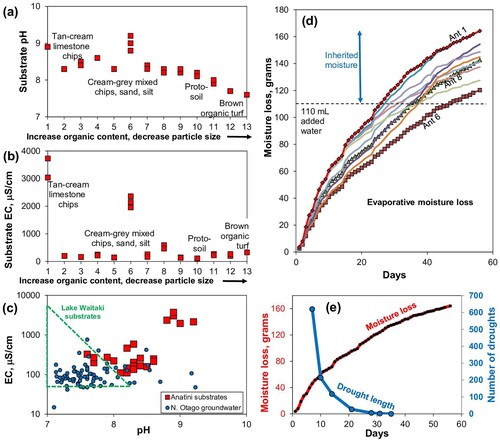
Figure 11. Groundwater compositions in the parts of the North Otago sedimentary sequence that are dominated by limestone (data from ORC Citation1993). Data for leachates from limestone debris at the Lake Waitaki site (Craw et al. Citation2022). Typical schist basement waters are also compared (purple boxes; Craw et al. Citation2022). All alkalinity is assumed to be bicarbonate. A–C, Dissolved Ca, Mg, and bicarbonate, in relation to carbonate dissolution lines (see text). D, E, Dissolved Na, K and Cl in relation to typical seawater (via marine aerosols). F, Sulphate versus Cl, showing excess sulphate in relation to marine aerosol contributions.
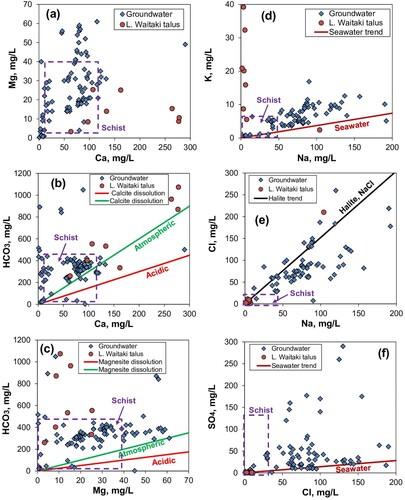
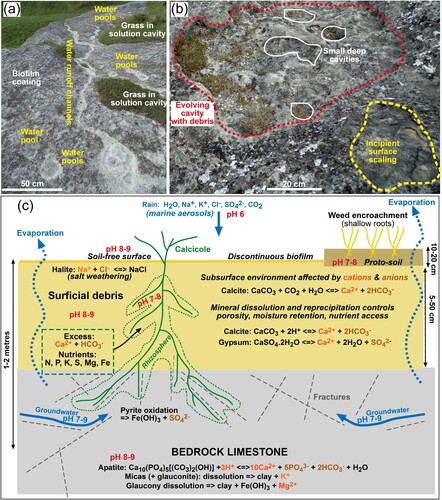
Figure 12. Summary of physical and chemical microhabitats for calcicoles. A, Otekaike Limestone outcrop at Elephant Rocks, showing sites of incipient water passage and pooling (white) across the biofilm-coated limestone. B, Otekaike Limestone outcrop at Elephant Rocks, showing three stages in evolution of surficial solution cavities. Initial decomposition of the surface crust and surface scale fragmentation (yellow, lower right) creates enhanced water pools. Further dissolution of calcite makes larger depressions with accumulated debris (red, centre and top). Localised water pools become deepened as even more calcite is dissolved and more debris accumulates (white, centre and top). C, Cartoon cross section (not to scale) of substrates hosting calcicoles, with principal chemical reactions relevant to geochemical evolution of the plant growth environments.
Data availability statement
Most data directly relevant to this study are included within this paper or within cited references. Additional data are tabulated, along with additional figures mentioned in the text, in a Supplementary file available at figshare.com: doi: 10.6084/m9.figshare.25582794
.