
Figures & data
Figure 1. Map of Aotearoa New Zealand showing the six study locations, indicated by blue stars, spanning c. 520 km in total: five locations along the north-east coast of the North Island and one along the north-east coast of the South Island.
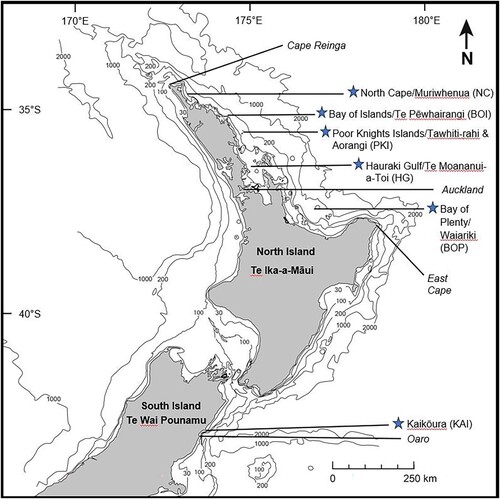
Table 1. Details of study regions, vessels operating in each region and data contribution of each vessel to this study. Note there were no high-quality (Q1 – Q2) photographs taken before 2007, so the photo-identification catalogue spans 2007–2019 only (see Methods section).
Figure 2. Summary of encounters with pilot whales (n = 81), new identifications and resights of individuals by year, between 2003 and 2019. Blue stacked bars indicate pilot whale encounters by whale watch tour operators (n = 23) and grey stacked bars indicate encounters by research vessels (n = 58). Black points represent the number of new pilot whale IDs assigned per year (n = 145) and orange points represent the number of individuals resighted each year (n = 59).
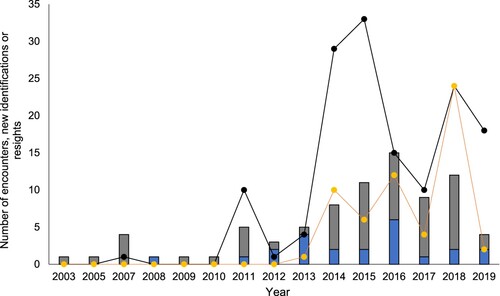
Figure 3. Summary of encounters with pilot whales (n = 81) and pilot whale stranding events off eastern New Zealand by month, between 2003 and 2019 (n = 27). Numbers above the bars are total numbers of strandings for each month. Stranding data includes entries for both ‘Globicephala melas’ (n = 20) and ‘Globicephala sp.’ (n = 7) from the New Zealand Whale Stranding Database (Department of Conservation Citation2019).
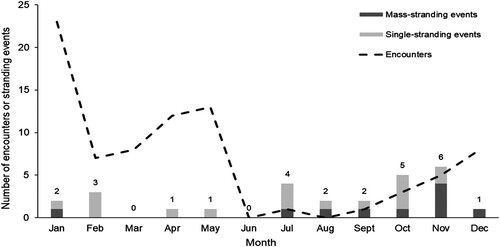
Figure 4. Group sizes (n = 79) of pilot whales encountered off eastern New Zealand between 2003 and 2019 (median = 50, IQ = 30–80, range = 5–250).
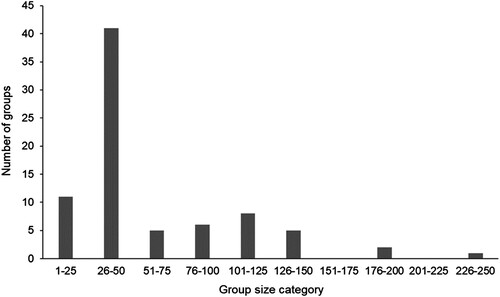
Figure 5. Locations of pilot whale sightings between 2003 and 2019 (n = 81) off the north-east North Island (A), Bay of Plenty (B) and Kaikōura (C), New Zealand. Yellow circles indicate groups consisting of pilot whales only (n = 17). Blue boxes indicate mixed-species groups of pilot whales and oceanic bottlenose dolphins (n = 58). The stars indicate mixed groups of pilot whales, oceanic bottlenose dolphins and false killer whales (n = 5). The triangle in (B) indicates one encounter of a mixed-species group of pilot whales, oceanic bottlenose dolphins and southern right whale dolphins (n = 1). The polygon represents the survey area of the research vessel Manawanui between 2016 and 2019, with boundaries based on the outermost survey locations (polygon area = 4128.29 km2).
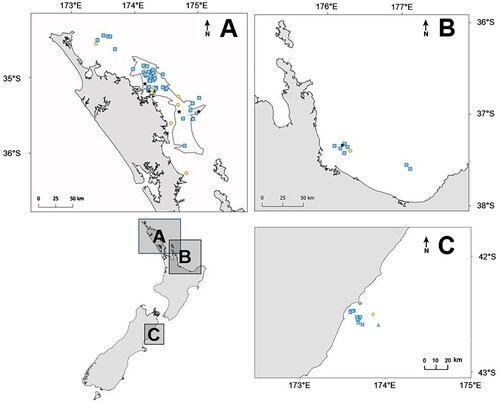
Figure 6. Discovery curves of pilot whales encountered off (A) all of eastern New Zealand (n = 145) and (B) the north-east North Island of New Zealand only (n = 131), from the first photo-identified animal in 2007 until 2019. The number of identified individuals is shown in relation to the cumulative number of identifications made (maximum one identification per day). Note the different x- and y-axis for each graph.
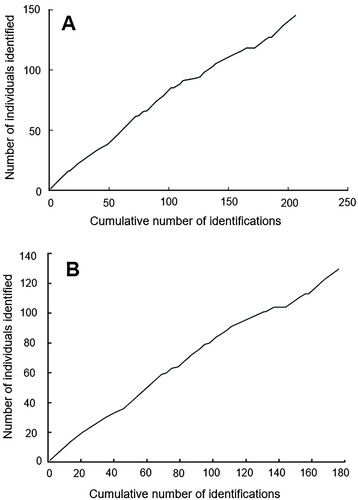
Table 2. Comparison of mark rates of selected dolphin species. While mark-rate calculations were not uniform across studies, all relied on notches and nicks to determine the distinctiveness of individuals.
Supplemental material
Download MS Word (14.9 KB)Data availability statement
The photo-identification catalogue data that support the findings of this study are openly available on figshare at DOI: https://doi.org/10.17608/k6.auckland.23549817.