
Figures & data
Figure 1. The process of data inclusion and grouping. AP: acute pancreatitis; HTG-AP: hypertriglyceridemic acute pancreatitis; SAP: severe acute pancreatitis; MSAP: moderately severe acute pancreatitis; MAP: mild acute pancreatitis; LMWH: low molecular weight heparin; BISAP: bedside index for severity in acute pancreatitis.
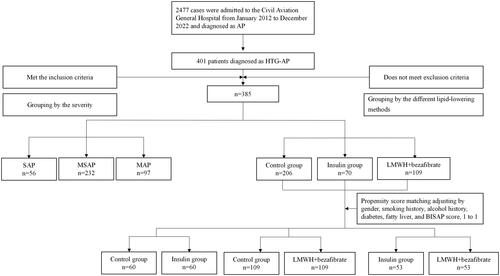
Figure 2. The number of patients with HTG-AP and other AP in the Civil Aviation General Hospital from January 2012 to December 2023. AP: acute pancreatitis; HTG-AP: hypertriglyceridemic acute pancreatitis.
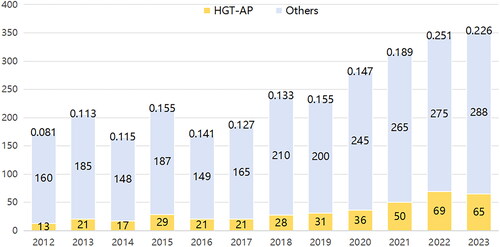
Table 1. The general clinical data of MAP,MSAP and SAP.
Table 2. Characteristics and clinical outcomes of 48-h and 72-h TG attainment.
Table 3. The area under the ROC curve of TG predicting SAP.
Table 4. Characteristics and clinical outcomes of different lipid-lowering methods.
Table 5. Characteristics and clinical outcomes of different lipid-lowering methods by propensity score matching.