Figures & data
Figure 1. Roost sites for each Norfolk Island Morepork sampled across Norfolk Island during the austral spring of 2020 and austral autumn of 2021. The grey shaded areas represent vegetation. The National Park is outlined with a dashed line. Each colour represents a different owl. The owls marked in pink and purple were sampled only in spring. The owl marked in light blue was sampled only in autumn.
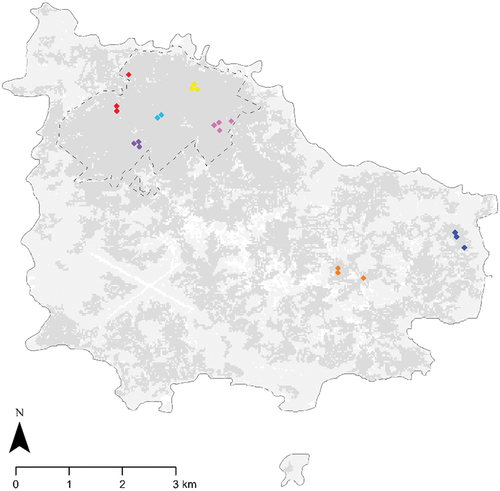
Table 1. Dietary items consumed by Norfolk Island Moreporks as shown by eDNA analysis. Numbers represent the total number of pellets or scats that contained a particular prey item. Scat samples are shown in bold. Detections from scat and pellet samples collected on the same day are included. Total count represents the total number of detections of each species, with samples from the same or consecutive day excluded. Paired owls are identified with ‘a/b’.
Table 2. Abundance of each prey taxa identified for individual Norfolk Island Morepork using visual analysis of pellets in the breeding and non-breeding seasons. Abundance indicates the minimum possible number of individuals of each prey taxa consumed per owl. Paired owls are identified with ‘a/b’. The total number of pellets collected per individual/pair is shown.
Figure 2. Average ∆ richness for each taxonomic group comparing (a) visual and eDNA analysis and (b) eDNA analysis of scats and pellets collected from Norfolk Island Moreporks. In Figure 1(a), negative values represent greater taxa richness detected with visual analysis and positive values represent greater richness with eDNA. In Figure 1(b), negative values represent greater taxa richness identified in scats and positive values represent greater richness in pellets. Minimum and maximum ∆ richness per owl are shown with horizontal bars.