
Figures & data
Table 1. Description of treatment groups.
Figure 1. (A) L. reuteri PSC102 was killed at different temperatures (37 °C, 60 °C, 80 °C, and 100 °C) and time points (0, 15, 30, 45, and 60 min). Inactivation was measured by determining the colony forming units per milliliter at 15 min intervals after heat treatment. SEM image of (B) viable and (C) heat-inactivated L. reuteri PSC102.
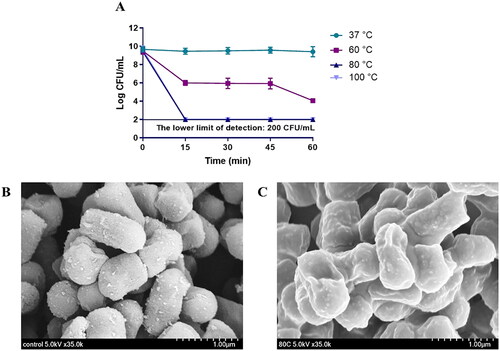
Figure 2. Effects of LR, LRG, and hLR on phagocytic activity, nitric oxide (NO) production, and cytokine expression. RAW264.7 macrophage cells were treated with LR, LRG, and hLR for 24 h. Phagocytic activity was determined by neutral red uptake assay (a). NO production was measured using griess reagent (B), and cytokines were measured via qRT-PCR: (C) iNOS, (D) TNF-α, (E) IL-1β, (F) IL-6, and (G) Cox-2. (H) Cell viability. PBS (vehicle), negative control; LPS (100 ng/mL), positive control; LR, live L. reuteri PSC102 (109 CFU/mL); LRG, L. reuteri PSC102 ghost (109 CFU/mL) and hLR, heat-killed L. reuteri PSC102 (109 CFU/mL). Data are presented as mean ± SEM (n = 3). Different letters (a–d) above the bars indicate significant differences (p < 0.05) between groups.
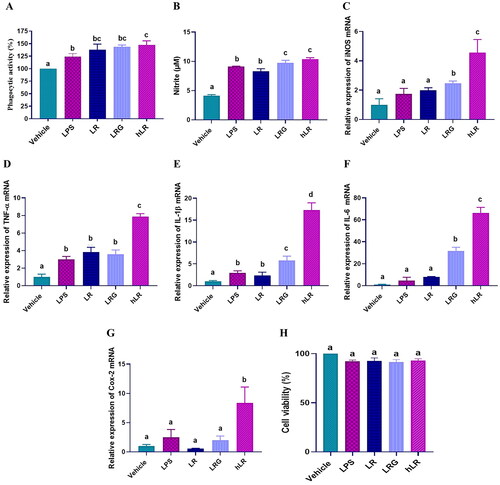
Figure 3. Effects of hLR and LR on body weight (a), thymus and spleen indices (B), and spleen tissues in CTX-treated rats (C). Spleen tissues were stained with H&E for histomorphology images (observed at 200×; scale bar = 100 μm). The white arrows indicate necrotic lesions. Data are expressed as mean ± SEM (n = 8). Significant differences (p < 0.05) between the groups are indicated with different letters (a–b) in superscript.
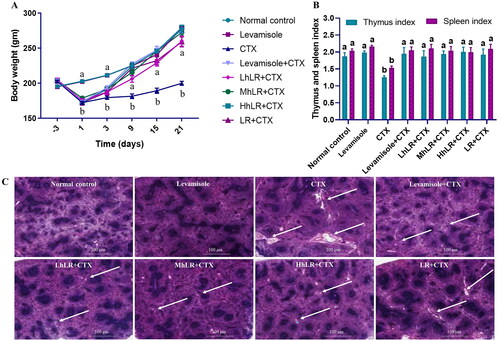
Table 2. Effects of hLR and LR on blood cell counts in CTX-induced immunosuppressive rats.
Figure 4. Effects of hLR and LR on neutrophil migration and phagocytosis, and splenocyte proliferation in CTX-induced immunosuppressive rats. A) Total neutrophils count in different groups. B) Neutrophil migration and C) phagocytosis. D) Total splenocyte count in different groups. Ex vivo splenocyte proliferation induced by Con A (E) and LPS (F). Data are expressed as mean ± SEM (n = 4). Different letters (a–f) above the bars indicate significant differences among the groups (p < 0.05).
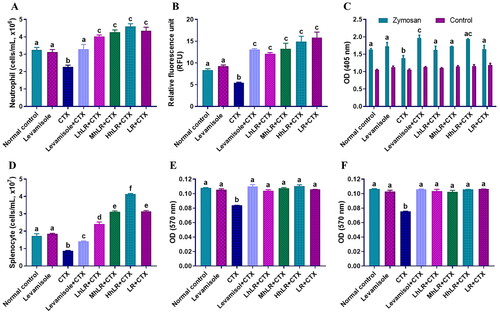
Figure 5. Effects of hLR and LR on PBMC T lymphocyte subsets in CTX-treated rats. A) Percentage of CD4+ (R1 region) and CD8+ (R3 region) T cell population. B) Percentage of CD45RA+ (R1 region) and CD28+ (R3 region) T cell population. Data are expressed as mean ± SEM (n = 4). Different letters (a–c) above the bars indicate significant differences (p < 0.05) between groups.
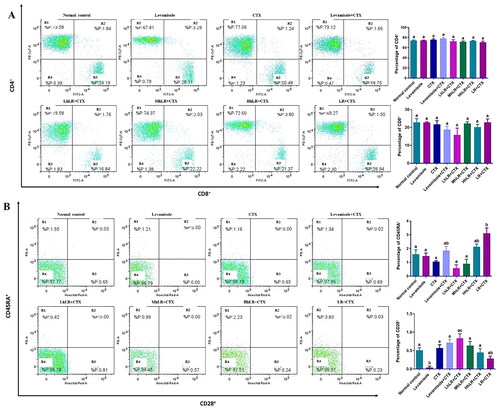
Figure 6. Effects of hLR and LR on thymic T lymphocyte subsets in CTX-treated rats. Percentage of CD4+/CD8+ (R2 region) T cell population. Data are expressed as mean ± SEM (n = 4). Different letters above the bars indicate significant differences (p < 0.05) between groups.
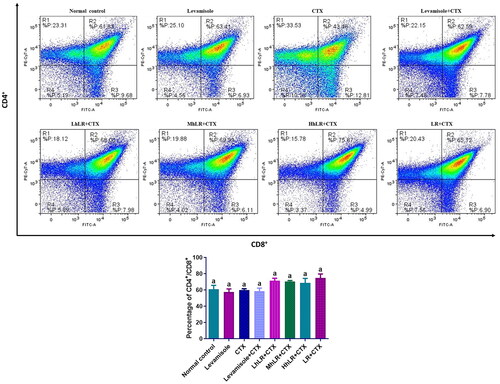
Figure 7. Effects of hLR and LR on splenic T lymphocyte subsets in CTX-treated rats. A) Percentage of CD4+ (R1 region) and CD8+ (R3 region) T cell population. B) Percentage of CD45RA+ (R1 region) and CD28+ (R3 region) T cell population. Data are expressed as mean ± SEM (n = 4). Different letters (a–b) above the bars indicate significant differences (p < 0.05) between groups.
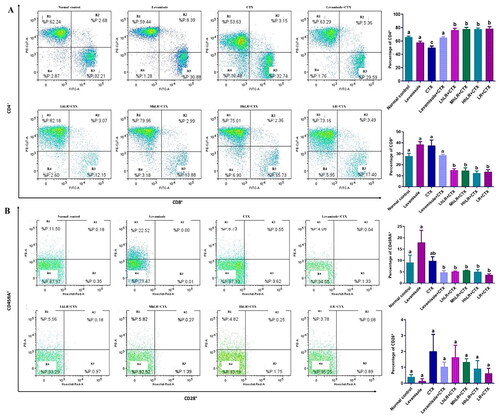
Table 3. Effects of hLR and LR on cytokine levels in serum obtained from CTX-treated rats.
Figure 8. Effects of hLR and LR administration on gut microbiota. (A) Alpha-diversity assessed by Chao 1, ACE, Jackknife, Shannon, and Simpson indices. (B) Composition of gut microbiota at the phylum level. (C) The relative abundance of Bacteroidetes, firmicutes, and proteobacteria. Data are presented as mean ± SEM (n = 3). Different letters (a–c) above the bars indicate significant differences (p < 0.05) between groups.
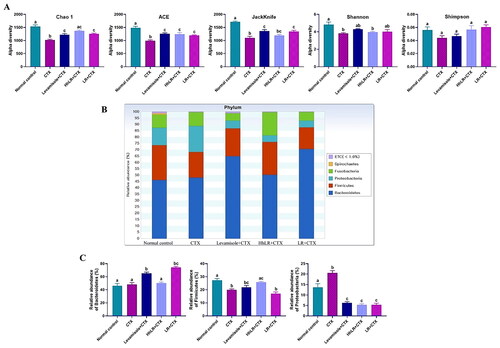
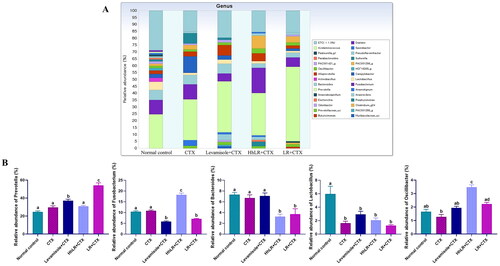
Figure 9. Effects of hLR and LR on the intestinal microbiota taxonomic composition. (A) Composition of gut microbiota at the genus level. (B) The relative abundance of Prevotella, Fusobacterium, Bacteroides, Lactobacillus, and Oscillibacter. Different letters (a–d) above the bars indicate significant differences (p < 0.05) between groups.
Supplemental Material
Download MS Word (740.5 KB)Data availability statement
The data obtained in the present study are available within the article and supplementary materials.