
Figures & data
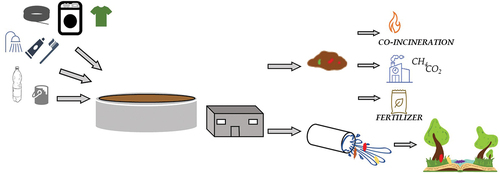
Figure 1. Ozonation of PP- and PET-contaminated sludge.
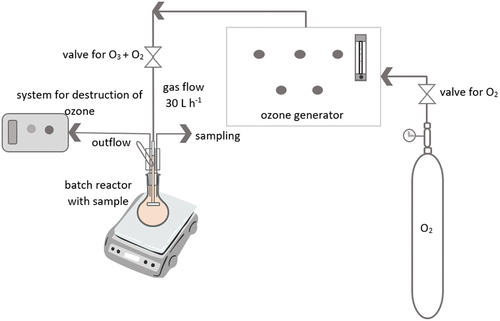
Figure 2. Formed CH4 ± SE and CO2 in comparison to control sample, according to added concentration of a) PET and b) PP [%].* indicates statistically significant differences (p < 0.05) in comparison to control sample.
![Figure 2. Formed CH4 ± SE and CO2 in comparison to control sample, according to added concentration of a) PET and b) PP [%].* indicates statistically significant differences (p < 0.05) in comparison to control sample.](/cms/asset/e7a45ef7-0a26-4128-ae6c-599906d573a5/bose_a_2332286_f0002_b.gif)
Table 1. Cumulative biogas production [hPa] ± SE of PP- and PET-contaminated anaerobic sludge in concentrations 0.1 10 g L−1, compared to control sample. * indicates statistically significant differences (p < 0.05) in comparison with control sample.
Figure 3. Methane yields ± SE (a) and biogas inhibition ± SE (b) of contaminated (1 g L−1) and ozonated sludge at dose 3.54 g h−1 for 10 min compared to control sample for [%]. * indicates statistically significant differences (p < 0.05) in comparison with control sample.
![Figure 3. Methane yields ± SE (a) and biogas inhibition ± SE (b) of contaminated (1 g L−1) and ozonated sludge at dose 3.54 g h−1 for 10 min compared to control sample for [%]. * indicates statistically significant differences (p < 0.05) in comparison with control sample.](/cms/asset/73ea179e-d10f-4200-8e9c-e5dae7a43011/bose_a_2332286_f0003_oc.jpg)
Figure 4. Methane yields ± SE (a) and biogas inhibition ± SE (b) of contaminated (1 g L−1) and ozonated sludge at dose 3.54 g h−1 for 20 min, compared to control sample [%]. * indicates statistically significant differences (p < 0.05) in comparison with control sample.
![Figure 4. Methane yields ± SE (a) and biogas inhibition ± SE (b) of contaminated (1 g L−1) and ozonated sludge at dose 3.54 g h−1 for 20 min, compared to control sample [%]. * indicates statistically significant differences (p < 0.05) in comparison with control sample.](/cms/asset/c7da4a0f-abb8-4627-b6f8-7b7fb3b00703/bose_a_2332286_f0004_oc.jpg)
Figure 5. Methane yields ± SE (a) and biogas inhibition ± SE (b) of contaminated (1 g L−1) and ozonated sludge at dose 3.54 g h−1 for 30 min, in comparison with control sample [%]. * indicates statistically significant differences (p < 0.05) in comparison with control sample.
![Figure 5. Methane yields ± SE (a) and biogas inhibition ± SE (b) of contaminated (1 g L−1) and ozonated sludge at dose 3.54 g h−1 for 30 min, in comparison with control sample [%]. * indicates statistically significant differences (p < 0.05) in comparison with control sample.](/cms/asset/ee481b24-7d8c-4711-a317-eff43e8163e2/bose_a_2332286_f0005_oc.jpg)
Figure 6. Methane yield ± SE (a) and biogas inhibition ± SE (b) of PP-contaminated and ozonated sludge at 10, 20, and 30 minutes of ozonation. * indicates statistically significant differences (p < 0.05) in comparison with control sample.
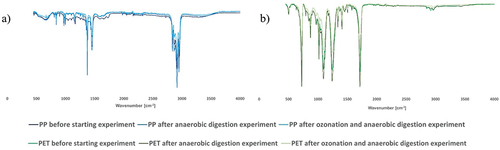
Figure 7. FTIR spectra of (a) PP and (b) PET particles (non-treated, after anaerobic digestion and ozonation).
Supplemental Material
Download JPEG Image (295.8 KB)
Supplemental Material
Download JPEG Image (295.2 KB)
Supplemental Material
Download MS Word (200 KB)Supplemental Material
Download (45 KB)Data availability statement
The data that support the findings of this study are available from the corresponding author, upon reasonable request.