Figures & data
Figure 1. Block flow diagrams of studied ozone injection technologies: (a) conventional line; (b) OSW line. The main three process steps – mass transfer, mixing and reaction – are shown in each case. In the conventional line, these processes occur simultaneously in a reaction basin, while the OSW treatment line separates them in three independent units. During the mass transfer step, a highly concentrated dissolved ozone solution (OSW) is produced under pH adjustment with CO2 addition (down to 5). The mixture of the OSW with the process liquid occurs in a static mixer, while the reaction step takes place at the reaction basin already installed.
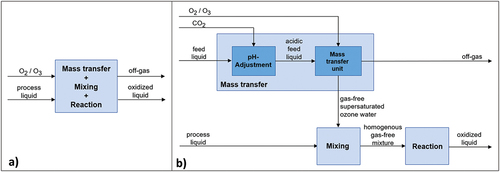
Figure 2. Ozonation as advanced treatment step of the WWTP Duisburg-Vierlinden, Wirtschaftsbetriebe Duisburg – aöR Germany. The plant is equipped with two independent treatment lines operating parallelly. In the picture, the OSW treatment line is depicted on the left side and the standard technology line on the right side. Numbers in the picture correspond to: 1) OSW production plant (ozone generator container and contactors), 2) CO2 supply, 3) the influent pipes to reactors, 4) independent reactor basins (left: OSW treatment, right: standard pump injection), 5) OSW injection using a static mixer, 6) ozone gas injection for the standard injection system, 7) ozone generator and equipment location of the pump injector system, and 8) O2 supply.
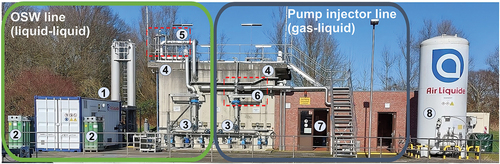
Figure 3. Elimination achieved at different specific ozone doses for: the OSW injection and the pump-injector system by the actual study (yellow circles and blue triangles, respectively), and diffusers and pump-injector system at the previous study (orange diamonds and unfilled blue triangles, respectively). The eliminations achieved for each micropollutant are presented accordingly: (a) 1H-benzotriazole, (b) metoprolol, (c) sulfamethoxazole, and (d) diclofenac. The mean eliminations for all selected compounds (indicator parameters) were calculated as recommended by the KOM-M.NRW (Citation2016) and are presented separately in: (e) standard injection mechanisms and (f) OSW injection system.
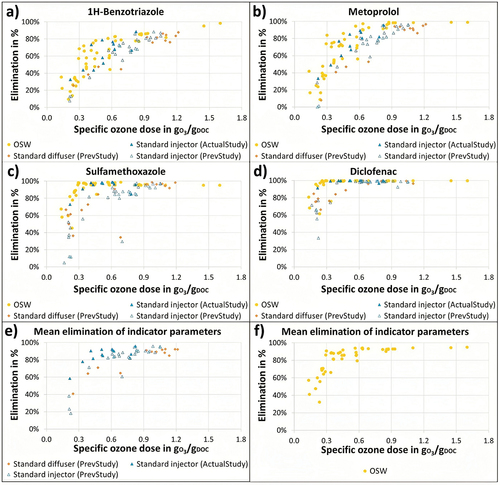
Figure 4. Required reaction time to achieve maximal elimination using the OSW system for the substances: (a) 1Hbenzotriazole, (b) metoprolol, (c) sulfamethoxazole, and (d) diclofenac as well as for the corresponding (e) mean elimination values for all six MPs (indicator parameters). The elimination achieved at different reaction times are shown for two specific sampling campaigns where the ozone reaction was stopped in samples taken just after the mixing step of the OSW treatment line. The maximal eliminations were determined by allowing the ozone reaction to proceed entirely and are presented as reference lines (1st sampling campaign: blue; 2nd sampling campaign: orange). Samples were quenched with KI at different reaction times (1st sampling campaign: purple; 2nd sampling campaign: gray). The initial concentrations of each compound are given in the title of each graph as high relevant aspect during the calculation of the achieved elimination. The VOD abbreviation corresponds to the catalytic vent ozone destructor installed on each treatment line.
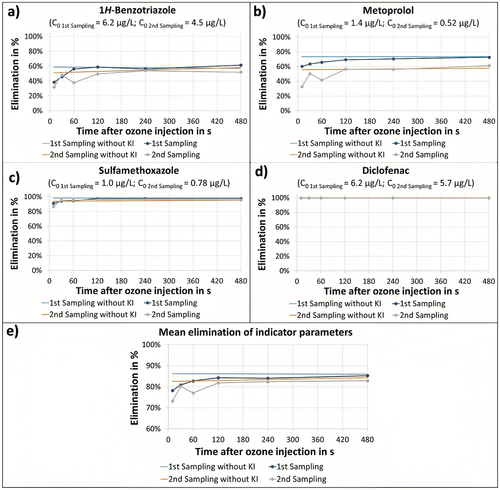
Table 1. Basic parameter values and main treatment conditions for both sampling campaigns for the determination of the required reaction time to achieve maximal elimination using the ozone strong water system. The immediate ozone consumption, i.e., directly after injection of the OSW flow into the static mixer, was measured. The residual ozone available for the further reaction step was calculated by the difference between the specific ozone dose and the immediate ozone consumption related to DOC.
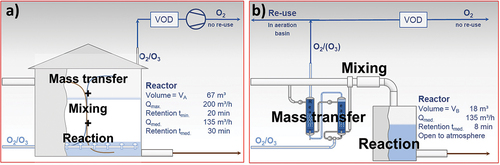
Figure 5. Overview of studied lines and needed dimension for equal MP elimination grades: (a) conventional ozone injection technology line; (b) OSW line. The main process steps are shown as well as their schematic representation (no scaled). The ‘volume A’ refers to the installed reactor volume for the standard ozonation at the WWTP DuisburgVierlinden, while ‘volume B’ refers to the theoretical reactor size needed taking the highest required reaction time until maximal elimination of MP observed during this study as middle retention time (8 min). The size relation follows VB = 0.27 VA. A possible re-use of the oxygen/ozone flow after the mass transfer step was discussed and therefore, presented in figure B.