
Figures & data
Figure 1. Publications on Central Asia in the PRC (1992–2022).
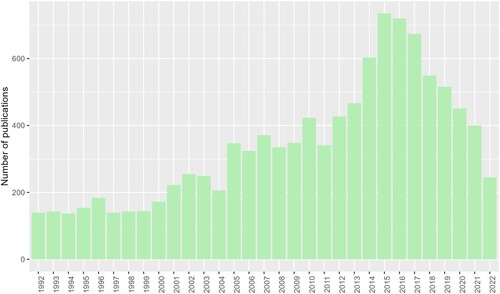
Figure 2. Highest number of publications on Central Asia in Chinese journals (1992–2022).
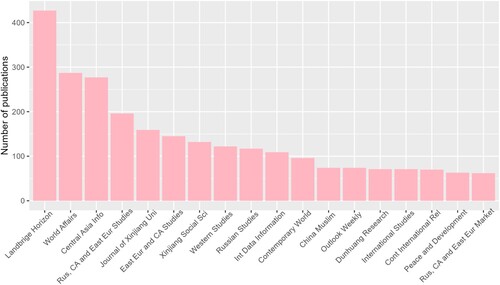
Figure 3. Most prolific researchers of Central Asia in the PRC (1992–2022).
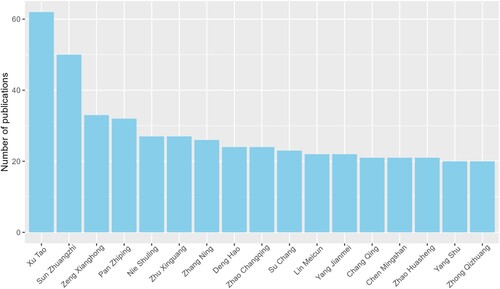
Table 1. Qualitative clusters resulting from the Structural Topic Model.
Figure 4. Top 15 topics for topic prevalence in the corpus.
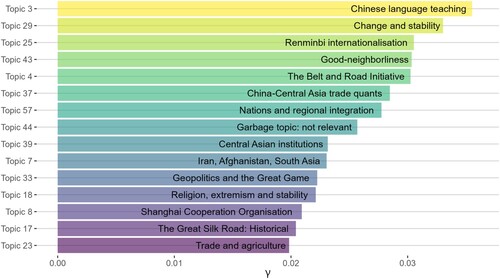
Figure 5. Topic prevalence of topics in cluster 3 on language studies over time (1992–2022).
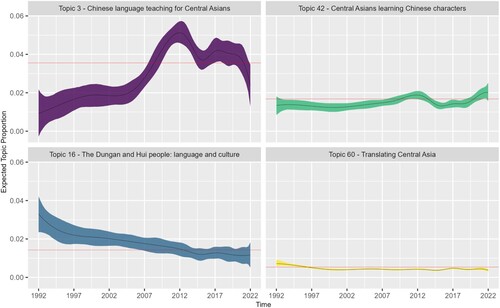
Figure 6. Topic prevalence over time of topics in Cluster 8 on security and internal politics (1992–2022).
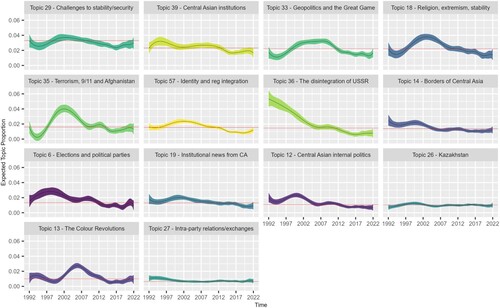
Figure 7. Topic prevalence over time of topics in Cluster 2 on Macroeconomics (1992–2022).
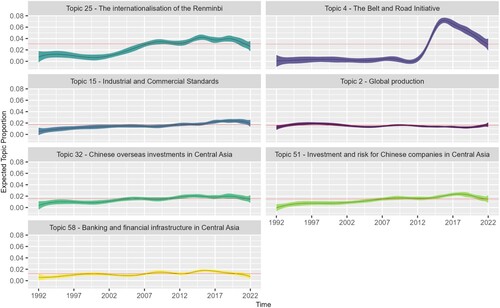
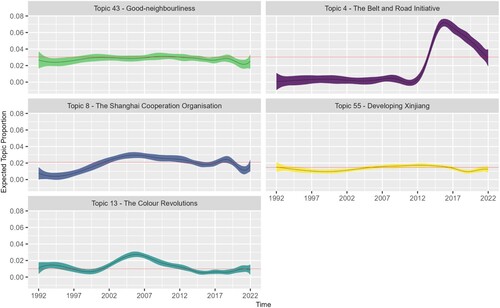
Figure 8. Topic prevalence over time of topics in Cluster 4 on Chinese governmental narratives (1992–2022).
Supplemental Material
Download MS Word (1.5 MB)Data availability
Our dataset can be accessed here: https://doi.org/10.6084/m9.figshare.23648466.