
Figures & data
Figure 1. Hyperthermia synergized with chemotherapy in promoting caspase-8 accumulation in cancer cells. (A) HepG2 cells were heated at 43 °C in water-bath for indicated times in the absence or presence of CDDP. (B) HepG2 cells were heated at indicated temperatures for 1 h. (C) HepG2 cells were treated with CDDP at different concentrations in combination with hyperthermia at 42.5 °C. (D) HepG2 cells were heated at 42.5 °C for 1 h, then cultured for various times. The densitometry ratio of Western blots of caspase-8 to GAPDH was quantified (bottom panels). Data are expressed as mean ± standard deviation (SD), three independent experiments. * p < 0.05, **p < 0.01,***p < 0.001, ****p < 0.0001 by t-test. Ns: not significant, compared to control.
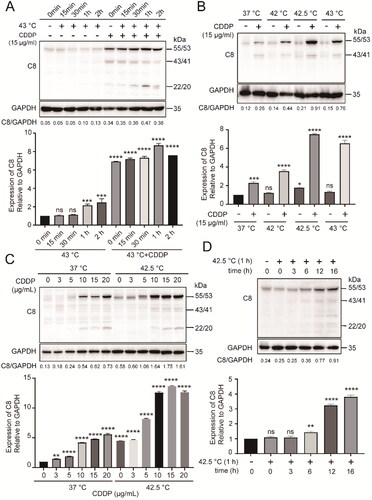
Figure 2. Combination therapy promoted apoptosis of cancer cells in correlation with caspase-8 activation. (A) HepG2 cells were heated at 42.5 °C for 1h in the presence of CDDP (15 µg/mL). Cells were harvested 16 h later and cell lysates were used for assay of enzymatic activities of caspase-8 and caspase-3. (B and C) Analysis of caspase-8 and caspase-3 activation (B) and enzymatic activities (C) in the presence of pan-caspase inhibitor. (D) Cells were treated as in (A), stained with Annexin V-FITC and PI, and analyzed by flow cytometry. (E) Quantification of apoptosis in (D). (F) Cells were treated as in (A), cell viability was measured by CCK-8 assay. Data are expressed as mean ± standard deviation (SD), three independent experiments. **p < 0.01, ***p < 0.001, ****p < 0.0001 by t-test.
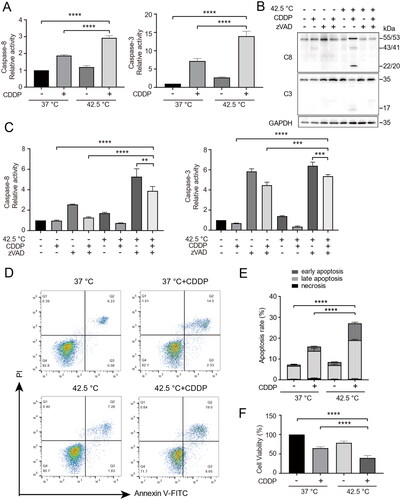
Figure 3. Knockout of caspase-8 decreased the sensitivity of cancer cells to combination therapy. (A) Caspase-8 gene was edited by CRISPR/Cas9 in HepG2 cells. Targeted PCR of genomic DNA of two cloned caspase-8 knockout cells (Cas9-C8) showed deletion of a segment of caspase-8 gene. (B) Western blotting analysis of caspase-8 protein expression in the two cloned Cas9-C8 cells in (A). (C) WT and Cas9-C8 cells were treated with CDDP (15 µg/mL) and heated at 42.5 °C for 1 h. Cell viability was measured by CCK-8 assay. (D) Cells were treated as in (C) and clone formation assay was performed. Cells were fixed and stained with crystal violet and clone formation rate was calculated (right panel). Data are expressed as mean ± standard deviation (SD), three independent experiments. * p < 0.05, ****p < 0.0001 by t-test.
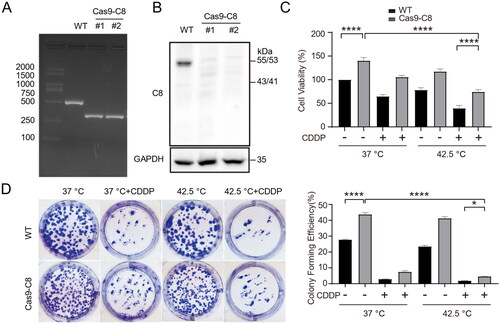
Figure 4. Combination therapy increased K63-linked polyubiquitination of caspase-8 and enhanced its interaction with p62. (A) HepG2 cells were treated with combination therapy for 1 h and cultured for another 3 h. Cell lysates were used for immunoprecipitation with antibodies specific to caspase-8 and immunoblotting were performed to analyze ubiquitination. (B) Cells were treated as in (A) in the presence of 5 µM MG132 for 4 h. (C and D) Cells were transfected with siRNAs targeting CUL3 (50 nM) for 48 h. Cell lysates were subjected to immunoblotting (C) and immunoprecipitation (D). NTC, negative siRNA control. (E) The colocalization of p62 and caspase-8 proteins was examined by immunofluorescence staining and visualized under Confocal microscopy (DAPI, cell nuclei). Scale bar, 10 μm. (F) Cells were treated with combination therapy, and cell lysates were analyzed for CUL3 expression by western blotting. (G) Co-IP of caspase-8 by p62 in cells lysates. (H) Cells were treated as in (A) in the presence of 100 nM BafA1 for 10 h or 500 nM Rapamycin for 8 h, and then analyzed by immunoblotting to evaluated caspase-8 and autophagy proteins. Data are presentative of three independent experiments.
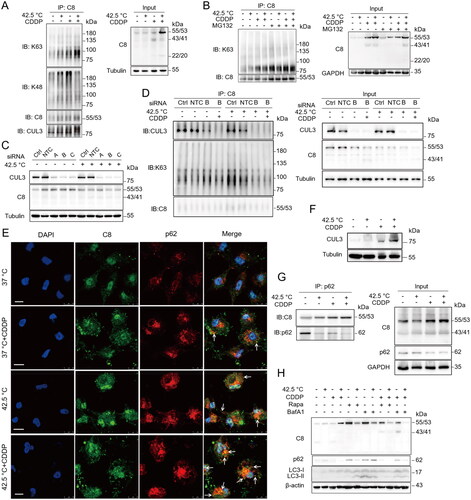
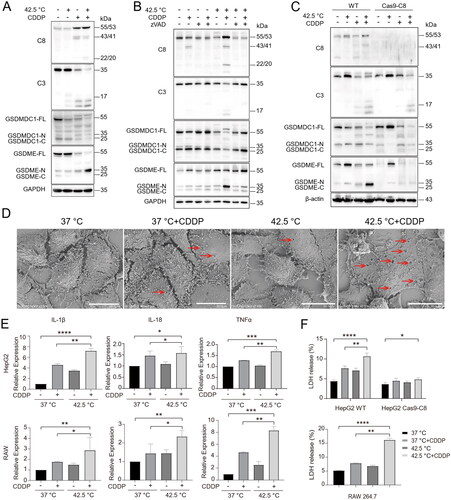
Figure 5. Hyperthermia synergized with chemotherapy to promote caspase-8 dependent pyroptosis of cancer cells. (A) HepG2 cells were treated as indicated and cell lysates were analyzed for caspases and gasdermins by Western blotting with indicated antibodies. (B) HepG2 cells were pretreated with 40 µM pan-caspase inhibitor zVAD-fmk for 2 h and then treated with various therapies. Caspases and gasdermins were analyzed by Western blotting with antibodies as indicated. (C) WT and Caspase-8 knockout HepG2 cells were treated with various therapies and assessed as in (B). (D) HepG2 cells were treated with various therapies and pyroptosis was examined by scanning electron microscopy (SEM). Arrows indicate pores on cell membranes. Scale bar, 20 μm. (E) mRNA expression of inflammatory cytokines IL-1β, IL-18 and TNFα in HepG2 cells and RAW264.7 cells. (F) Measurement of LDH release in WT and Caspase-8 knockout HepG2 cells, and RAW264.7 cells. Data are expressed as mean ± standard deviation (SD), three independent experiments. * p < 0.05, **p < 0.01,***p < 0.001, ****p < 0.0001 compared to control; t-test.
Supplemental Material
Download Zip (18.6 MB)Data availability statement
Data are available upon request.