
Figures & data
Table 1. Effects of innovation and efficiency on firm-level employment.
Table 2. Employment growth and innovation.
Table 3. Share of turnover from new products (average).
Figure 1. Share of sales of new products and employment growth (average) by industry.
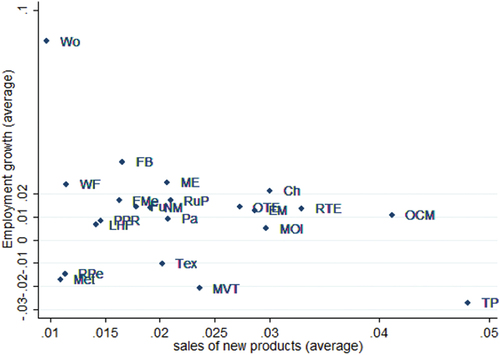
Table 4. Employment, efficiency, and innovation.
Figure 2. Efficiency by sub-sector of the manufacturing sector.
10 The boxplot shows: the median (middle line inside each box), the 25th and 75th quartiles are represented by the bottom and top of each box, the height of the box is the inter-quartile range, the upper and lower adjacent values depict the spread of the distribution outside the inter-quartile range.
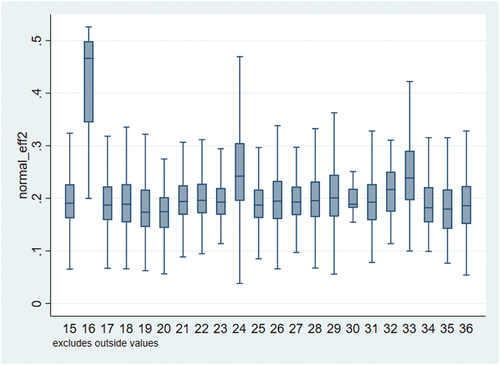
Table 5. Dynamics of efficiency: lag, present and forward.
Table A1 Time decay frontier model