426
Views
0
CrossRef citations to date
0
Altmetric
Research Article

Exploring grammatical development in children aged 2;6 to 7: a novel approach using elicited production

, , &
Received 14 Oct 2023, Accepted 02 Mar 2024, Published online: 25 Mar 2024

Figures & data

Table 1. Descriptive statistics for the grammar analysis.

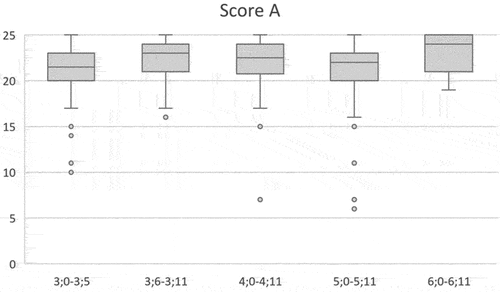
Figure 1. Boxplot of score a results.

Figure 1. Boxplot of score a results.

Figure 2. Proportion of children producing main clauses with finite verbs in second position (Score A). Dashed line: 50% milestone, dotted line: 90% red flag.
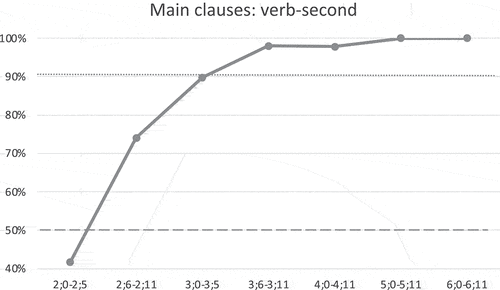
Figure 2. Proportion of children producing main clauses with finite verbs in second position (Score A). Dashed line: 50% milestone, dotted line: 90% red flag.

Figure 3. Proportion of children producing main clauses with nonfinite/finite verbs in final position (Score B). Dashed line: 50% milestone, dotted line: 10% red flag.
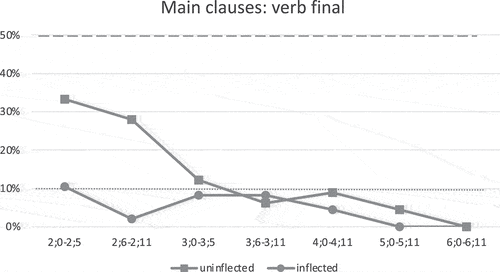
Figure 3. Proportion of children producing main clauses with nonfinite/finite verbs in final position (Score B). Dashed line: 50% milestone, dotted line: 10% red flag.

Figure 4. Proportion of children producing correct subject-verb agreement correctly (Score A)/incorrectly (Score B). Dashed line: 50% milestone, dotted line: 90% resp.10% red flag.
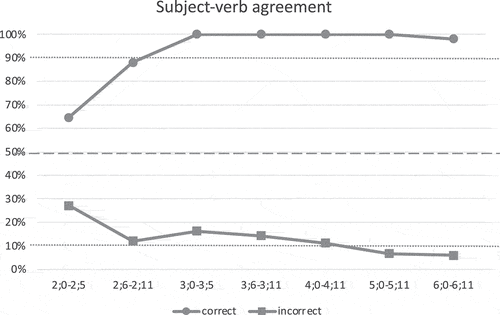
Figure 4. Proportion of children producing correct subject-verb agreement correctly (Score A)/incorrectly (Score B). Dashed line: 50% milestone, dotted line: 90% resp.10% red flag.

Table 2. Scoring example of Anni, 4;1 years.

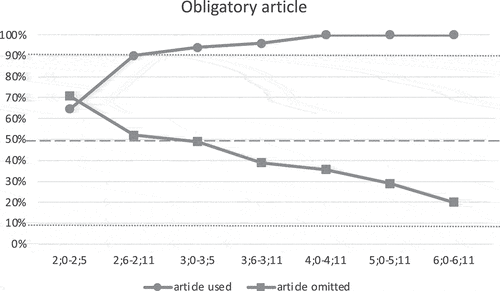
Figure 5. Proportion of children producing (Score A)/omitting (Score B) obligatory articles in noun phrases. Dashed line: 50% milestone, dotted line: 90% resp. 10% red flag.

Figure 5. Proportion of children producing (Score A)/omitting (Score B) obligatory articles in noun phrases. Dashed line: 50% milestone, dotted line: 90% resp. 10% red flag.