
Figures & data
Figure 1. Flow diagram of articles and studies selection process.
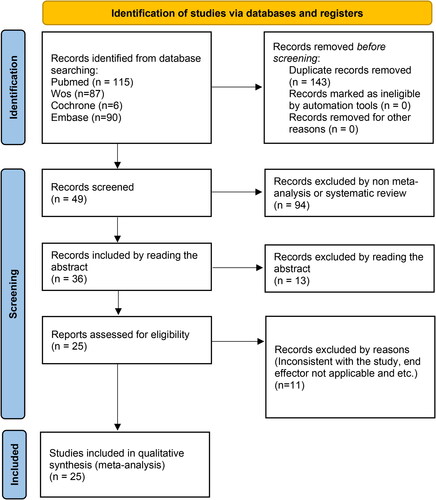
Table 1. Characteristics of included study.
Figure 2. The effectiveness of specific immunotherapy (SIT) on symptom scores. Results of the meta-analysis summarized in terms of effect size on symptoms. CI indicates confidence interval; SLIT, sublingual immunotherapy; SCIT, subcutaneous immunotherapy; and SMD, standardized mean difference.
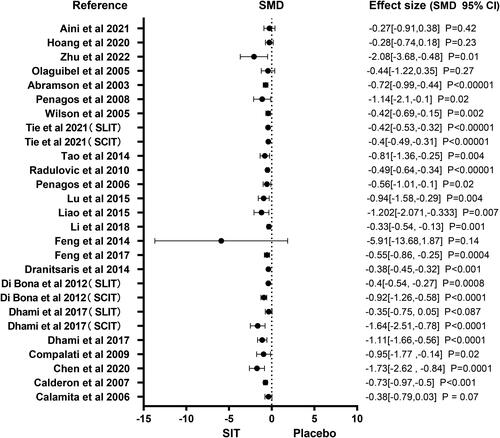
Figure 3. Forest plot of (a) medication score, (b) adverse events, and (c) the symptoms plus medication from the meta-analysis.
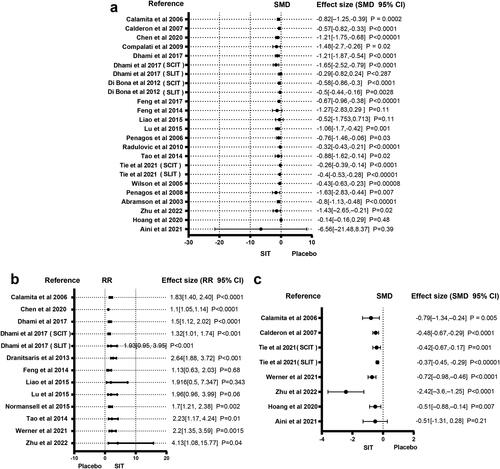
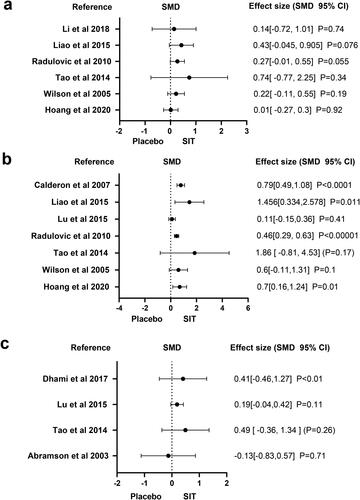
Figure 4. Forest plot of the (a) IgE levels, (b) IgG4 levels, and (c) FEV1 levels from the meta-analysis.
Supplemental Material
Download MS Word (1.3 MB)Data availability statement
The data that support the findings of this study are available from the corresponding author upon reasonable request.