
Figures & data
Figure 1. The study water area (21°35’ − 27°43’ N and 115°7’ − 125°33’ E) and locations of recorded maritime accidents.
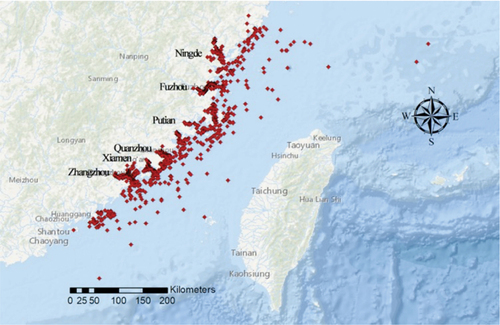
Table 1. Descriptive statistics of the maritime accident characteristics in the Fujian water area.
Figure 2. Flowchart of methodology.
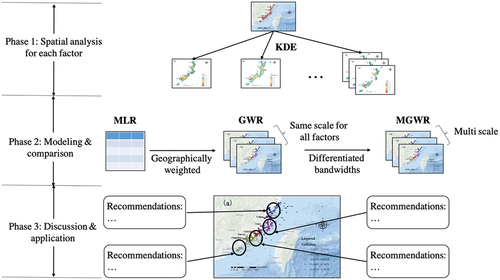
Figure 3. Heat map for the maritime accidents in Fujian water area: (a) accident frequency; (b) accident consequence.
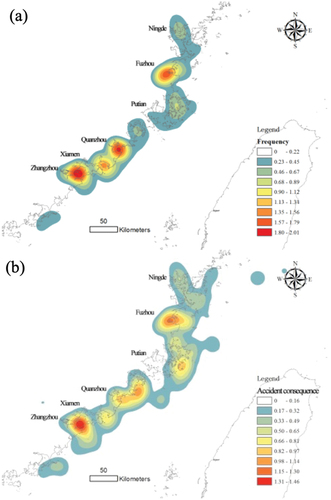
Table 2. Comparison of the performance of the three models.
Table 3. Results of the three models.
Table 4. Summary statistics for MGWR parameter estimates.
Figure 4. Coefficient distributions of influencing factors estimated by MGWR.
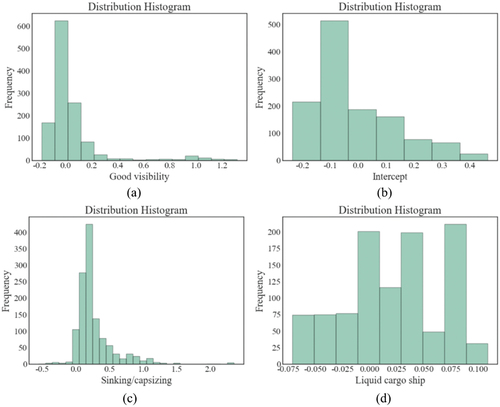
Figure 5. (Continued).
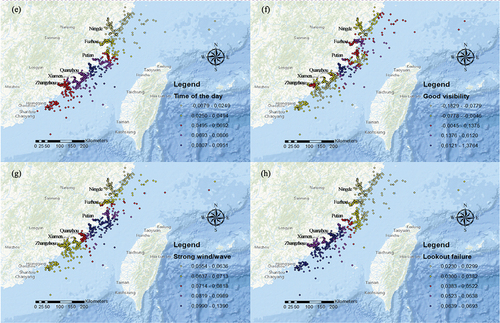
Figure 6. (Continued).
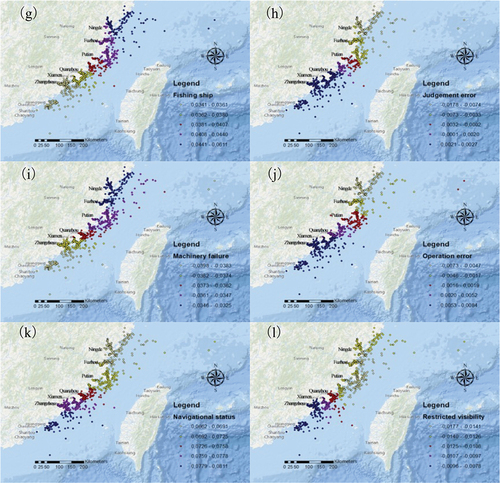
Figure 5. Spatial heterogeneity in the effects of micro-scale factors on maritime accidents.
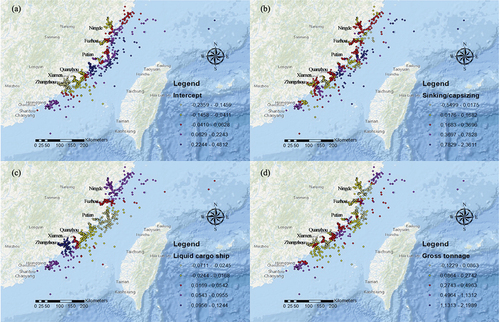
Figure 6. Spatial heterogeneity in the effects of global-scale factors on maritime accident consequence.
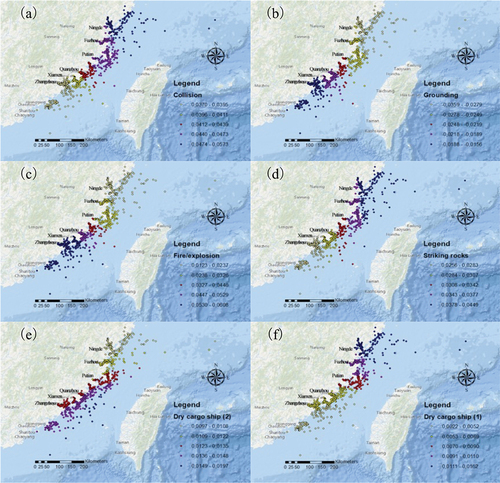
Figure A1. Heat maps for the maritime accident variables based on KDE.
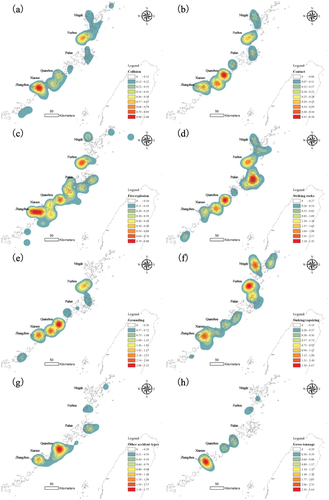
Figure A1. (Continued).
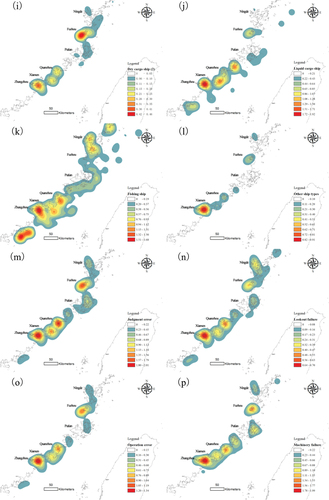
Figure A1. (Continued).
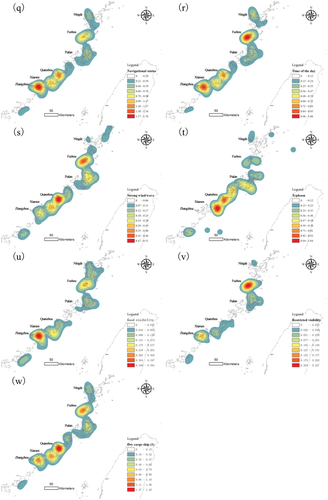
Figure A2. Boxplot for marginal effects of MGWR results (outliers are excluded).
Table A1. Nomenclature.