Figures & data
Figure 1. Dry matter of spent hop samples used for laboratory analysis and comparison of humulone content in dried and moist spent hop samples. Analysis was performed in duplicate and values represent mean values with variations being within the reproducibility of the method. Samples depicted with “*” were sampled from HopGuns® after dry hopping. Abbreviations for hop varieties used according to IHGC: AZA: Azacca, CAS: Cascade, CEN: Centennial, CHI: Chinook, CIT: Citra, COM: Comet, CRY: Crystal, ENI: Enigma, GXY: Galaxy, HBC: Hallertauer blanc, HMN: Huell melon, MBA: Mandarina Bavaria, MOS: Mosaic, SIM: Simcoe, SIR: Saphir, VG1: Amarillo.
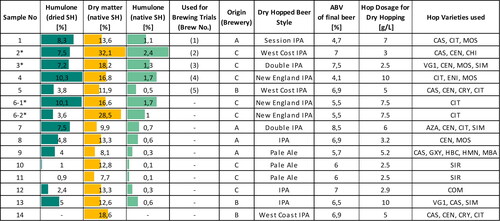
Figure 2. Dry matter of and corresponding surplus beer in spent hop samples. Numbers at icons correspond to respective sample number. (A) Amount of surplus beer determined via sedimentation in imhoff-cones. (B) Amount of surplus beer determined via centrifugation in a laboratory centrifuge. (C) Overlay of A & B with cluster indication.
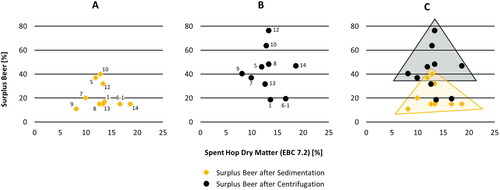
Figure 3. Humulone content of spent hop samples and corresponding hop pellets used for dry hopping batches. (A) Dot plot depicting the regression line and results of a correlation test according to Pearson (box). Sample no. 6–2 was treated as an outlier and hence removed from the dataset and not shown in the left diagram. (B) Bar chart additionally showing the recovery rates for humulone in spent hops. Samples depicted with “*” are taken from HopGuns®. Dots or bars depict mean value of a duplicate analysis and error bars (where shown) depict repeatability of the method used.
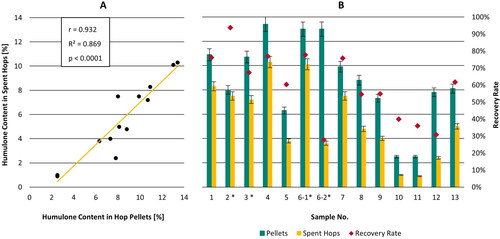
Figure 4. Iso-humulones & bitter units in experimental worts and beers. Sample codes refer to the spent hop sample used. “A” and “B” refer to the first and second brew per spent hop sample. Reference brews (“Ref”) were brewed with HHM pellets. Wort results adjusted to 12 % extract. Crosshatched bars show bitter units. Error bars show repeatability of the method. Each result represents the mean value of a duplicate analysis.
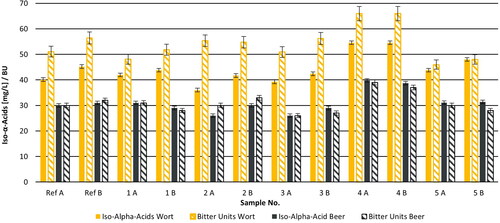
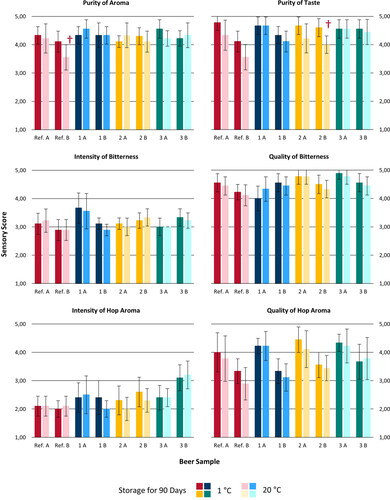
Figure 5. Average sensory scores of different descriptors for the experimental beers. Two-glass-test (storage of beer for 90 days at 1 °C vs. 20 °C) was applied. The repetitions of the brews (“B”) were evaluated in a second sensory session. Each result represents the mean value of ten panelist ratings. Error bars show 95 % interval of confidence. “†” indicates significant paired, two-sided t-test with α = 0,05.