Figures & data
Figure 1. Chemical structures of Rifampicin (RIF), Ritonavir (RTV), and Lopinavir (LOP).
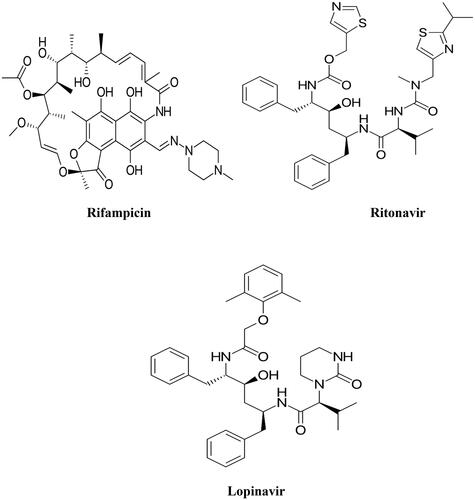
Table 1. Dose of marketed formulations.
Table 2. Chromatographic conditions for the simultaneous estimation of RIF, RTV, and LOP.
Table 3. Solubility parameter calculation for RIF, RTV, LOP and PVP VA using Hansen solubility parameter method.
Table 4. Experimental solubility data of pure RIF, RTV, and LOP (n = 3).
Figure 2. X-ray diffractograms of RIF, RTV, LOP, RIF-LOP-PM, RIF-RTV-PM, and RIF + RL-SD-PHS.
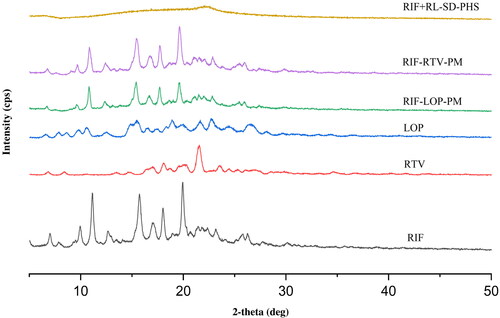
Figure 3. Overlay of DSC thermogram of before and after pH-shifted sample of RIF in presence of RL-SD.
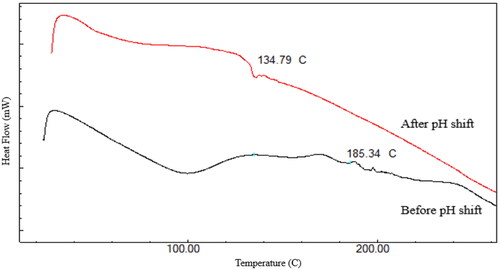
Figure 4. Overlay of FTIR spectra of A. RIF + RL-SD-PHS, B. RIF-LOP-PM, C. RIF-RTV-PM, D. RIF and E. RL–SD.
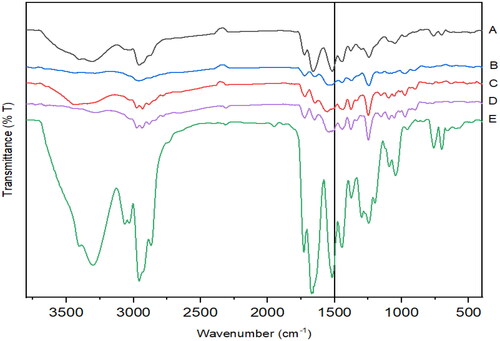
Figure 5. Possible interaction(s) of RIF with RL-SD in amorphous phase on pH-shift.
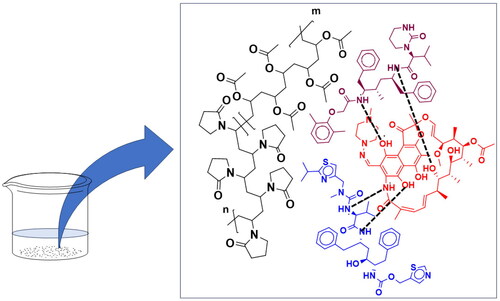
Figure 6. Schematic for interaction of RIF and RL-SD drug rich phase during the dissolution.
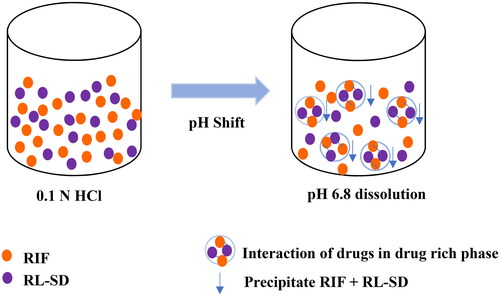
Figure 7. pH-shift Fluorescence pyrene probe method for RIF and RIF + RL–SD.
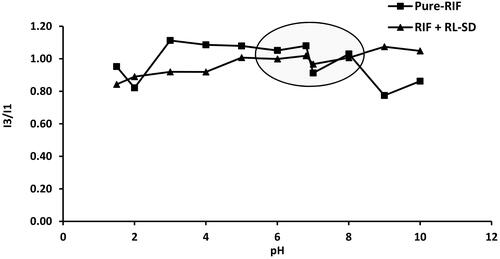
Figure 8. Supersaturation assay of RIF in pure RIF, and RIF + RL–SD in PBS (n = 3).
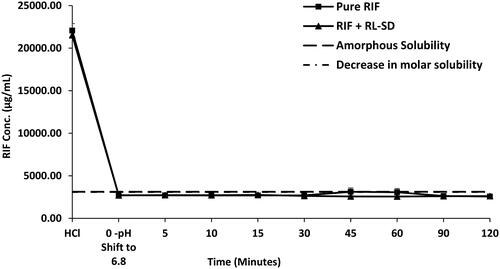
Figure 9. Supersaturation assay of RIF in pure-RIF, and RIF + RL–SD in FaSSIF (n = 3).
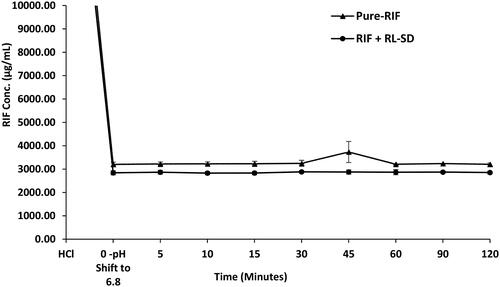
Figure 10. Supersaturation assay of RTV in RL-SD, and RIF + RL-SD in PBS (n = 3).
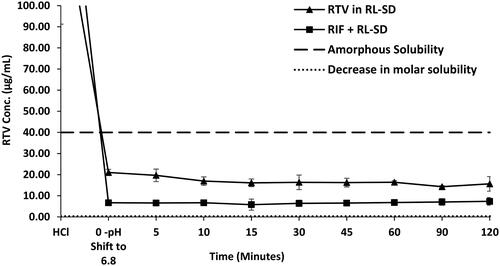
Figure 11. Supersaturation assay of LOP in RL-SD, and RIF + RL-SD in PBS (n = 3).
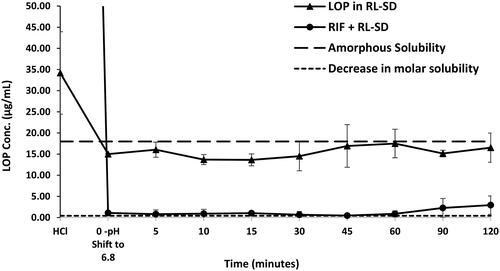
Figure 12. Supersaturation assay of RTV in RL-SD, and RIF + RL–SD in FaSSIF (n = 3).
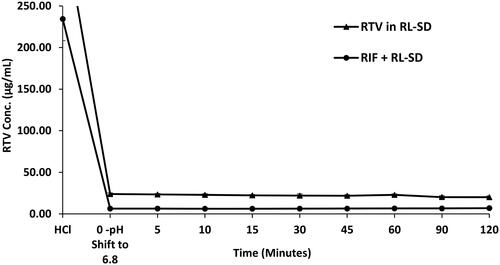
Figure 13. Supersaturation assay of LOP in RL-SD, and RIF + RL–SD in FaSSIF (n = 3).
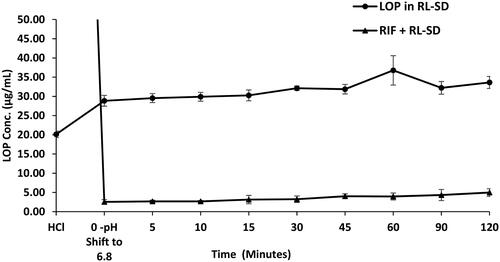
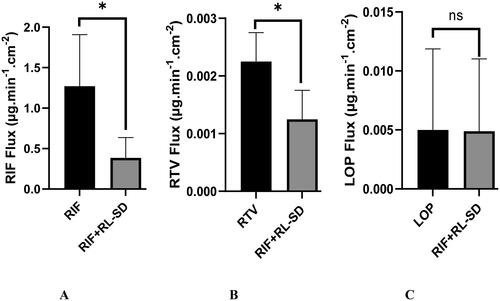
Figure 14. In-vitro flux study of A. RIF in pure RIF & RIF + RL–SD, B. RTV in RL-SD & RIF + RL–SD & C. LOP in RL-SD & RIF + RL–SD (*-statistically significant; n = 3).
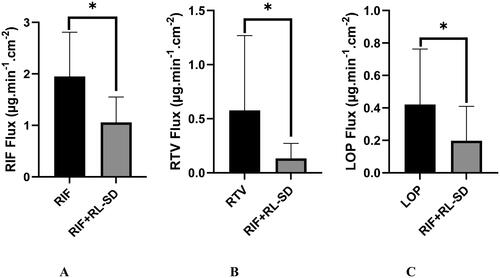
Figure 15. Ex-vivo flux study of A. RIF in pure RIF & RIF + RL–SD, B. RTV in RL-SD & RIF + RL–SD & C. LOP in RL-SD & RIF + RL–SD (*-statistically significant & ‘ns’-statistical insignificance; n = 3).