Figures & data
Figure 1. Monthly mean rainfall, mean maximum and minimum temperatures during the wheat-growing season from 2020 to 2022 in Nanjing, China.
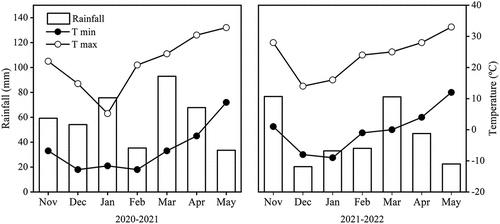
Table 1. The soil properties at the experimental site at the beginning of the experiment in two wheat growth seasons.
Table 2. Nitrogen application rates and basal nitrogen application stage under different nitrogen fertilizer managements.
Table 3. Effects of straw and nitrogen fertilizer managements on grain yield, N accumulation and N recovery efficiency (NRE).
Table 4. Effects of straw and nitrogen fertilizer managements on N accumulation and N accumulation rate during different growth periods.
Figure 2. Effects of straw and nitrogen fertilizer managements on root biomass at jointing (A, B), anthesis (C, D) and maturity (E, F) in 2020–2022. NS, SR and SP refer to no straw return, straw return by rotary tillage and straw return by ploughing, respectively. * and ** indicate significant differences at the 0.05 and 0.01 levels, respectively; ns indicates no significant difference. Whiskers on the top of the bars indicate standard error.
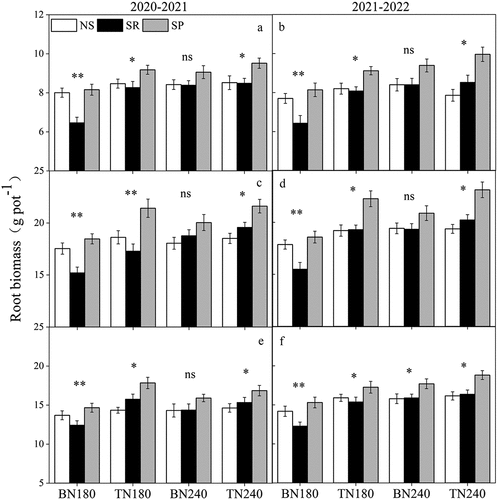
Figure 3. Effects of straw and nitrogen fertilizer managements on root weight density at jointing, anthesis and maturity in 2021–2022. NS, SR and SP refer to no straw return, straw return by rotary tillage and straw return by ploughing, respectively. The four rows from top to bottom show the root weight density under N management for BN240 (A, B, C), TN240 (D, E, F), BN180 (G, H, I) and TN180 (J, K, L), respectively. * and ** indicate significant differences at the 0.05 and 0.01 levels, respectively; ns indicates no significant difference. Whiskers on the top of the bars indicate standard error.
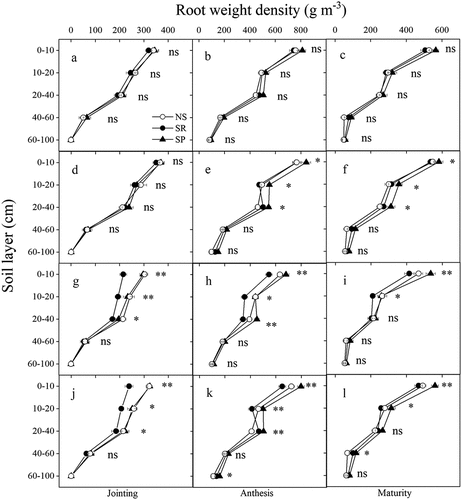
Figure 4. Effects of straw and nitrogen fertilizer managements on 15N residue content in different soil layers at jointing, anthesis and maturity stages in 2021–2022. NS, SR and SP refer to no straw return, straw return by rotary tillage and straw return by ploughing, respectively. The four rows from top to bottom show the root weight density under N management for BN240 (A, B, C), TN240 (D, E, F), BN180 (G, H, I) and TN180 (J, K, L), respectively. * and ** indicate significant differences at the 0.05 and 0.01 levels, respectively; ns indicates no significant difference. Whiskers on the top of the bars indicate standard error.
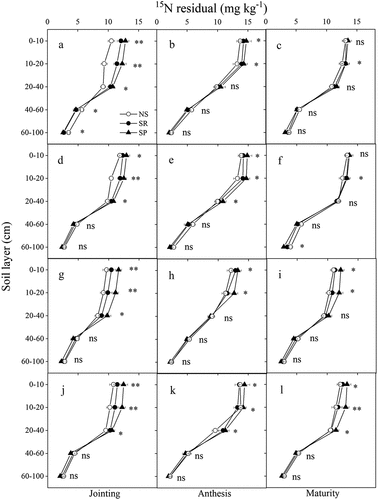
Figure 5. Effects of straw and nitrogen fertilizer managements on inorganic activity, microbial biomass C and microbial biomass N in the 0–20 cm soil layer at tillering, jointing and anthesis in 2021–2022. NS, SR and SP refer to no straw return, straw return by rotary tillage and straw return by ploughing, respectively. * and ** indicate significant differences at the 0.05 and 0.01 levels, respectively; ns indicates no significant difference. Whiskers on the top of the bars indicate standard error.
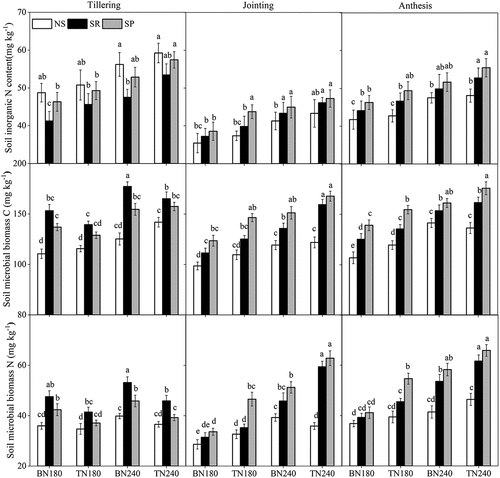
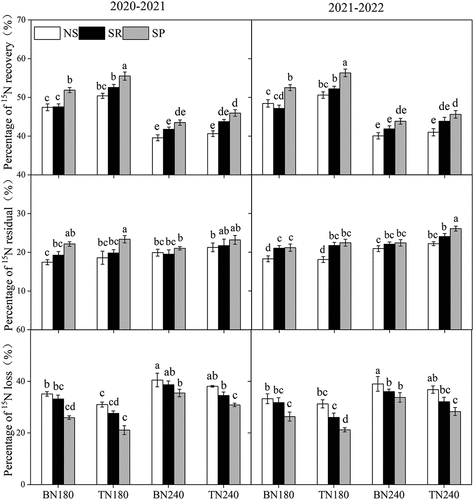
Figure 6. Effects of straw and nitrogen fertilizer managements on the fates of 15N fertilizer in 2021–2022. NS, SR and SP refer to no straw return, straw return by rotary tillage and straw return by ploughing, respectively. Whiskers on the top of the bars indicate standard error.