Figures & data
Figure 1. Examples of overdeepening types and scales. (a) Contoured map of the overdeepened glaciated trunk valley occupied by Ellsworth subglacial lake (100 m contours), West Antarctica (from Ross et al. Citation2011; modified by Cook and Swift Citation2012). (b) (top) Digital elevation model (DEM) of bed topography in the Gamburtsev Mountains, East Antarctica, showing a major overdeepened trough within a pre-glacial fluvial valley network. (inset and bottom) Valley profiles show the depth and extent of overdeepening (inc. smaller cirque, and hanging-valley types) along major valley axes (from Bo et al. Citation2009; modified by Cook and Swift Citation2012). (c) Longitudinal profile of a terminus overdeepening situated beneath Upernavik Isstrøm South outlet glacier in NW Greenland (from Morlighem et al. Citation2014; modified by Patton et al. Citation2016), extending ∼30 km up-valley beneath the ice. The location of the profile is shown in the inset (elevation axis exaggerated).
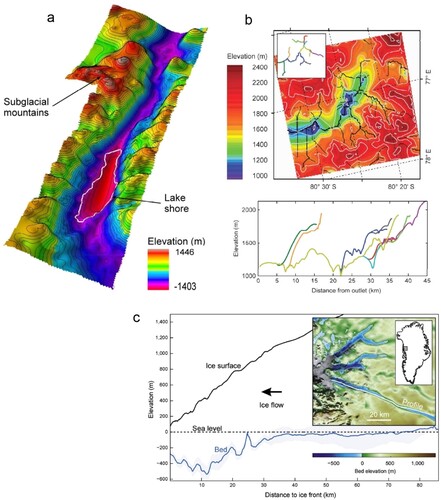
Figure 2. The study region in Labrador, Canada and surrounding region. Land topography data (lower left coordinate 52.0, −67.8 DD) (from SRTM3) ranges from sea level (turquoise) to ∼1600 m a.s.l (white). Bathymetric data (from GEBCO) of the adjacent continental shelf is shown in greyscale, ranging from sea level (white/grey) to ∼ 1700m depth (black). The inset image (top right) shows the location of the study region (white box).
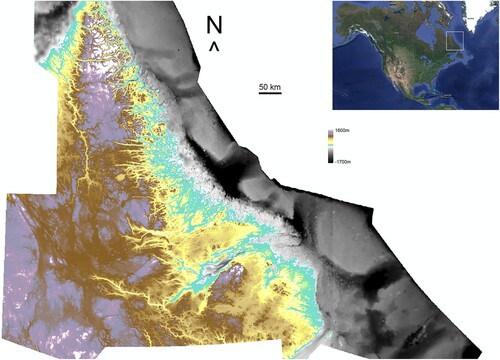
Figure 3. The main geological zones for the study area (modified from Wardle et al. Citation1997); igneous (orange), metamorphic (red), sedimentary (brown), and major faults (black) with associated shear and minor fault zones (yellow) collectively termed structural zones. The geological zones indicate the extent of geological analysis. Glacial confluence perimeters are shown in blue (see text). Background elevation model is the same as .
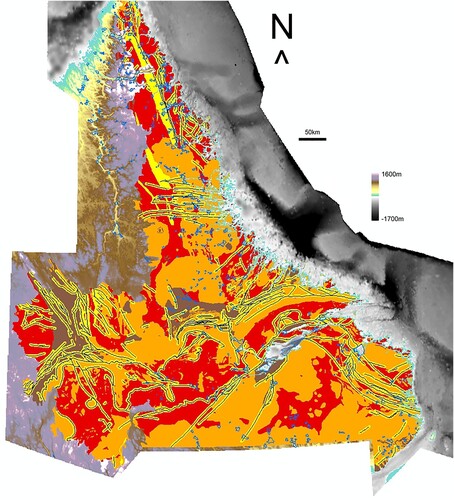
Figure 4. Schematic plans of topographically-induced overdeepenings. (a) A constriction in a valley. The narrower part of the valley with smaller cross-sectional area (CSA) will experience faster ice flow, and hence more erosion, than the wider part, thus producing an overdeepening here. (b). Schematic diagram of how valley CSA exerts a control on local ice velocity, potentially with a corresponding increase in erosion. (c) Valley confluences are also expected to be areas of localized ice velocity speed-up and maxima in local glacial erosion. Therefore overdeepenings should occur here (see text).
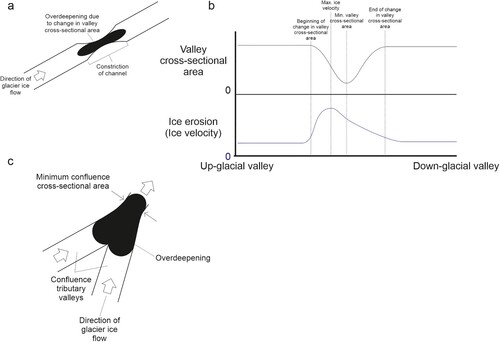
Table 1. Summary area statistics for the Labrador study region.
Table 2. Summary statistics showing the area co-location relationship between glacial confluence and overdeepenings.
Table 3. The chi-squared test of independence for the relationship between confluence and overdeepening.
Figure 5. The frequency distribution of ice-flow speed-up ratio, for confluences co-located (blue, top) and not co-located (light blue, bottom) with overdeepenings. (Top) 75.3% of co-located confluences display a speed-up ratio greater than 1, with long positive skew. (Bottom) Only 56.4% of confluences that are not co-located display a speed-up ratio greater than 1, with significantly shorter positive skew. Co-located confluences show significantly greater ice velocity speed-up (due to change in valley CSA) than do confluences that do not contain overdeepenings. This finding demonstrates that ice velocity influences the location of overdeepenings in confluences, and so the likelihood of an overdeepening occurring.
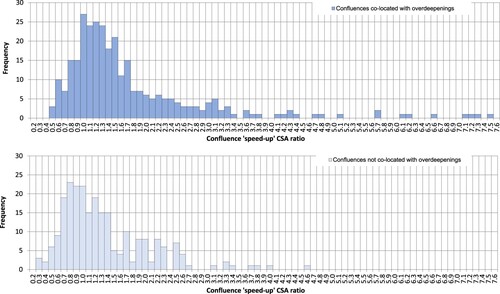
Table 4. Summary statistics showing the number, percentage, and average ratio values of confluences demonstrating ice velocity speed-up (i.e. a ratio > 1), for subsets of confluences.
Table 5. Summary area statistics used in analysis of the influence of particular rock types or structure.
Table 6. Summary statistics showing the area co-location relationship between geological zones and glacial confluence.
Table 7. The chi-squared test of independence for the relationship between structural (ST) zone and confluence.
Table 8. Summary statistics showing the area co-location relationship between geological zones and overdeepenings.
Table 9. The chi-squared test of independence for the relationship between structural zone (ST) and overdeepenings.
Table 10. Summary statistics showing the area co-location relationship between glacial confluence and the structural geology zone, for confluences with overdeepenings.
Table 11. The chi-squared test of independence for the relationship between structural zone (ST) and confluence, for only those confluences that contain overdeepenings (OD).
Table 12. Statistics, for subsets of confluences within the Labrador study region.
Figure 6. A statistically significant relationship is demonstrated between confluence CSA ratio (ice velocity speed-up) and co-located overdeepening depth in SRTM3 data within the structural geology zone. No such relationship is found elsewhere in Labrador. This scenario indicates that overdeepening depth is greater in confluences influenced by weaker (faulted) bedrock within the study region. Error bars indicate the largest absolute vertical linear error of the SRTM3 data, for which >90% has an absolute vertical linear error of < = 5 m (Farr et al. 2007). The potential error of CSA ratio values is not easily quantified but is not likely to limit interpretation of results.
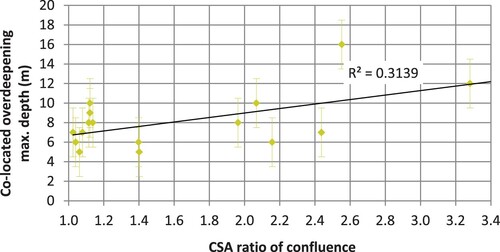
Figure 7. In the Swiss replicability test, a statistically significant relationship is demonstrated between confluence CSA ratio (ice velocity speed-up) and co-located overdeepening depth in SRTM3 data within the structural geology zone. This finding supports the outcome of the Labrador analysis, that overdeepening depth is greater in confluences influenced by weaker (faulted) bedrock. Error bars indicate the largest absolute vertical linear error of the SRTM3 data, for which >90% has an absolute vertical linear error of < = 10 m (Farr et al. 2007). The potential error of CSA ratio values is not easily quantified but is not likely to limit interpretation of results.
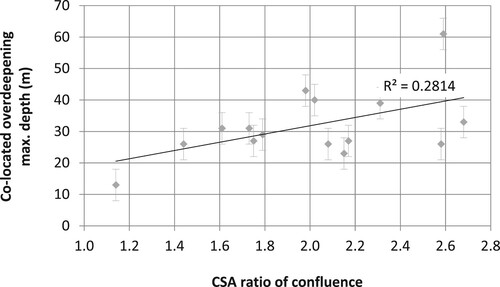
Figure 8. Schematic profile of two geological overdeepenings showing various lithologies and a structural fault zone, denoting change in bedrock competency. It is expected that structural fault zones and/or lithological zones of weak mass strength will concentrate glacial meltwater and increase ice velocity (via quarrying), thus increasing glacial erosion and developing overdeepenings (Haynes Citation1968; Seguinot Citation2008; MacGregor et al. Citation2009).
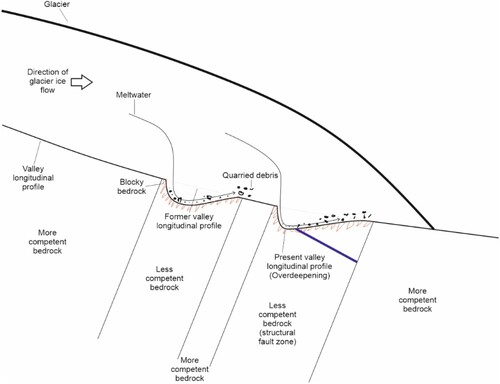
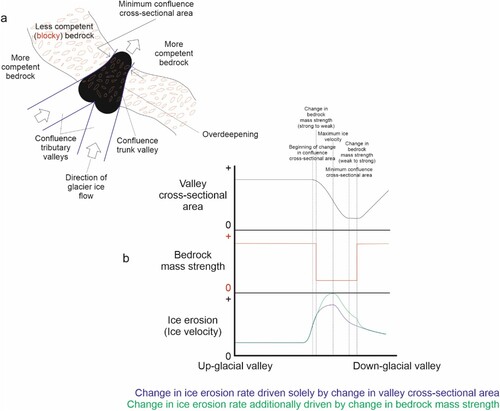
Figure 9. Overdeepening controlled by a combination of ice velocity increase in valley confluence and a reduction in bedrock competency. (a) Schematic plan of a valley confluence that occurs across several lithologies of differing bedrock competency. Where ice encounters a valley confluence (i.e. an effective decrease in CSA) along its course, there must be a localized increase in ice velocity and a corresponding increase in erosion, thus producing an overdeepening (see text). A decrease in bedrock competency will accentuate ice velocity and erosion. Quarrying can then better exploit blocky bedrock – developing the overdeepening (see text). (b) Process diagram for the above. Glacial erosion will scale nearly inversely with valley CSA, resulting in the production of an overdeepening (see and related text). Change in bedrock competency is expected to modify this relationship, amplifying or attenuating overdeepening development (i.e. depth) accordingly.