654
Views
0
CrossRef citations to date
0
Altmetric
Research Article

Seasonal dynamics of soil CO2 emissions from different semi-arid land-use systems

ORCID Icon, , , , , & show all
Article: 2312934 | Received 01 Dec 2023, Accepted 28 Jan 2024, Published online: 13 Feb 2024

Figures & data

Figure 1. Locality map showing the locations of the different land use and land cover systems used in this study.
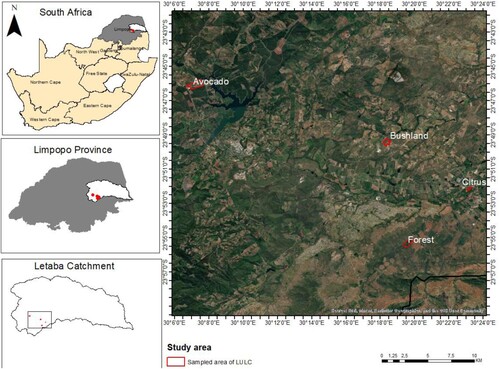
Figure 1. Locality map showing the locations of the different land use and land cover systems used in this study.

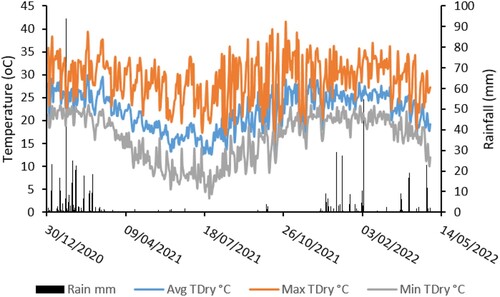
Figure 2. Prevailing rainfall and temperature conditions at the study site during the study period.

Figure 2. Prevailing rainfall and temperature conditions at the study site during the study period.

Table 1. Soil physical properties in the four land use systems.

Table 2. Soil chemical properties in the four land use systems.

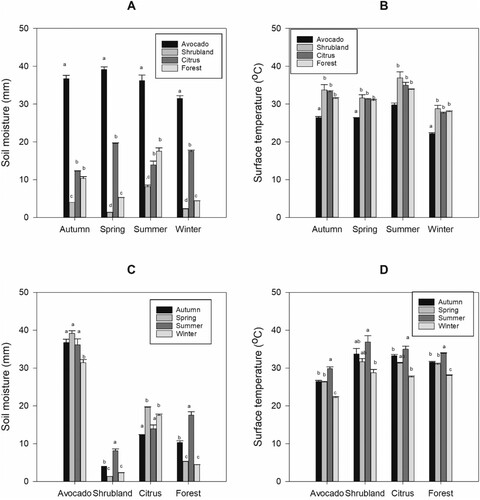
Figure 3. Soil moisture and surface temperatures in the different land use systems.

Figure 3. Soil moisture and surface temperatures in the different land use systems.

Figure 4. Variation among soil CO2 emission rates in different land use systems and seasons. The values presented for A and B are averages for the season while C are bi-weekly variations.
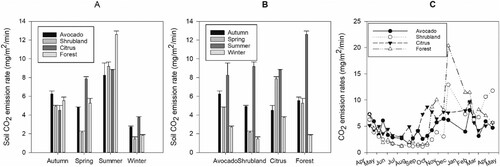
Figure 4. Variation among soil CO2 emission rates in different land use systems and seasons. The values presented for A and B are averages for the season while C are bi-weekly variations.

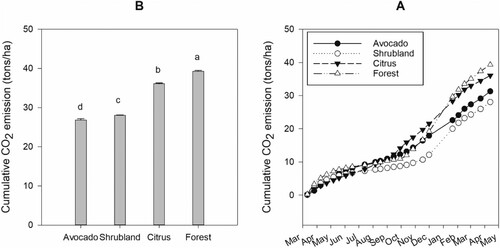
Figure 5. The cumulative amount of soil CO2 in four land use systems.

Figure 5. The cumulative amount of soil CO2 in four land use systems.

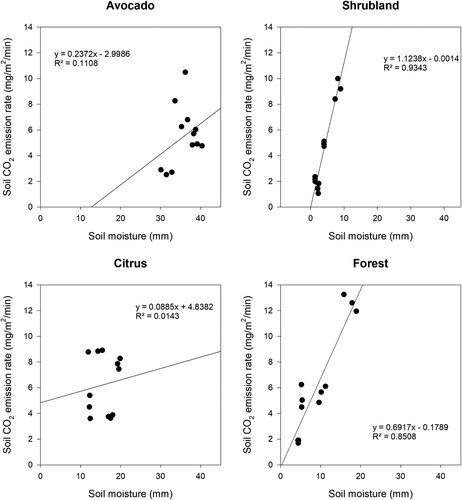
Figure 6. Relationship between soil moisture content and CO2 emission rates.

Figure 6. Relationship between soil moisture content and CO2 emission rates.

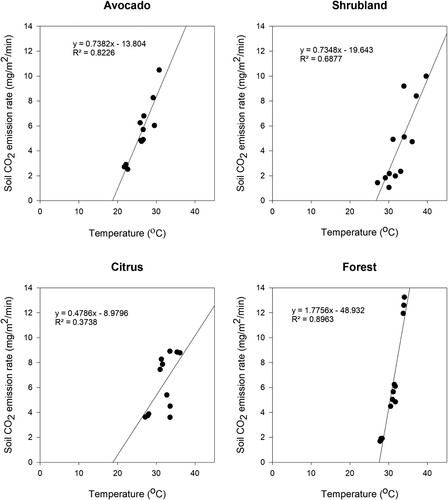
Figure 7. Relationship between surface soil temperature and CO2 emission rates.

Figure 7. Relationship between surface soil temperature and CO2 emission rates.

Table 3. Correlation between soil physical and chemical properties to the cumulative CO2.