
Figures & data
Figure 1. Due to the large number of deer in the area of SE Slovenia where our research was carried out, red deer also graze on permanent grassland during the day (photo: Dušan Glušac).
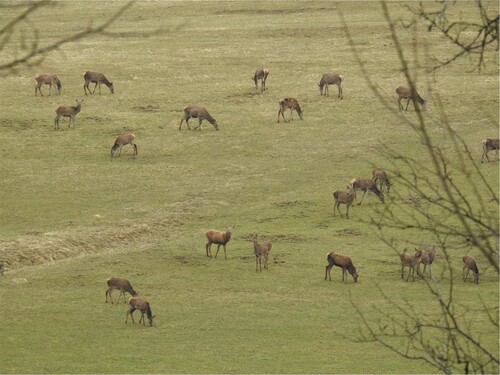
Table 1. Characteristics of the studied farms in Novi Lazi, Kačji Potok and Stari Breg.
Figure 2. The iron cage of the ‘protected’ treatment in Stari Breg during the third mowing, October 14, year 1 (photo: Stanislav Trdan).
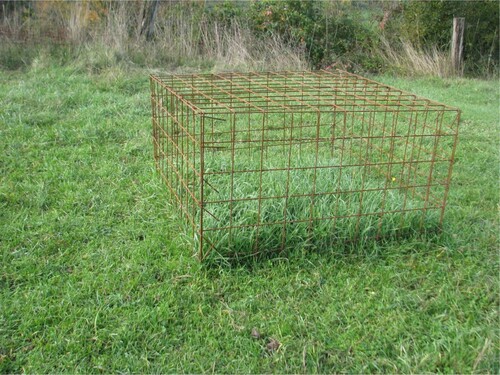
Table 2. Timeline of tasks in the research to determine the impact of deer grazing on the productivity of permanent grassland at three locations in the Kočevska region in year 1 and year 2.
Table 3. Assessment of the production capacity (annual yield of hay in t/ha) of grasslands on selected farms in the Kočevska region by class.
Table 4. The average yield of dry matter (t/ha) in the 1st, 2nd, and 3rd rows at the three locations and in the three treatments in year 1. The different letters denote values that represent statistically significant differences (Newman–Keuls test) at the 0.05 significance level.
Table 5. The average yield of dry matter (t/ha) at the 1st, 2nd and 3rd mowings at the three locations and in two or three treatments in year 2. The different letters denote values that represent statistically significant differences (Newman–Keuls test) at the 0.05 significance level.
Table 6. Average loss of yield of dry matter (in %) in year 1 and year 2.
Table 7. Contents of crude protein (CP), crude fibre (CF), metabolizable energy (ME) and net energy for lactation (NEL) of hay in the three locations during all three mowings in year 2.
Table 8. Average yield of dry matter of hay (H), crude protein (CP), and net energy for lactation (NEL) at three locations during all three mowings in year 2.
Table 9. The effect of game grazing on the cost of forage production on grassland.