
Figures & data
Figure 1. Cross-sectional view of Defense Waste Processing Facility (DWPF) melter representing a typical JHCM design. Reprinted with permission from Ref. [Citation40].
![Figure 1. Cross-sectional view of Defense Waste Processing Facility (DWPF) melter representing a typical JHCM design. Reprinted with permission from Ref. [Citation40].](/cms/asset/42dd4bd8-3b16-49cf-aa78-b81892f0981a/yimr_a_2211469_f0001_ob.jpg)
Table 1. Major U.S. nuclear waste treatment projects using JHCM for vitrification. Monofrax® K-3 is used as the refractory lining of all the JHCMs in the table.
Table 2. Compositions of Monofrax® K-3 [Citation64–66].
Figure 2. Representation of typical wear in refractories described in the literature [Citation58, Citation71].
![Figure 2. Representation of typical wear in refractories described in the literature [Citation58, Citation71].](/cms/asset/595d7136-700d-48cb-b86a-80f32b762ac5/yimr_a_2211469_f0002_oc.jpg)
Figure 3. Schematic representation of general crucible test method. (a) crucible setup (b) cross-section of the altered refractory test coupon after material loss. The measured ‘neck loss’ is calculated by , where Gc is the neck corrosion, G is the width of the coupon before test, and g is the width of the coupon at the melt line after test.
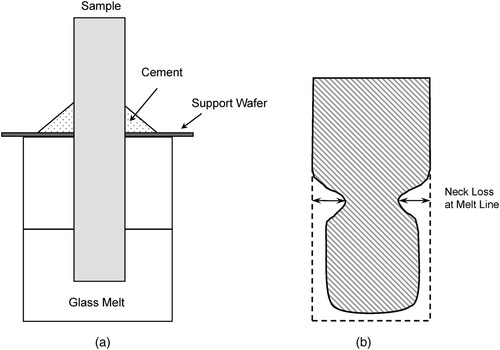
Table 3. Monofrax® K-3 Corrosion data from crucible tests with glass formulations typical for DWPF HLW following the ASTM-C621 methods.
Table 4. Monofrax® K-3 Corrosion data from crucible tests with a molten salt phase.
Figure 4. Monofrax® K-3 corrosion rate and normalized alkali oxide in mass % of the LAW glasses in the datasets of WTP baseline and ORP [Citation126].
![Figure 4. Monofrax® K-3 corrosion rate and normalized alkali oxide in mass % of the LAW glasses in the datasets of WTP baseline and ORP [Citation126].](/cms/asset/43ce5eb9-13c1-41c2-8206-94d6370c5f63/yimr_a_2211469_f0004_oc.jpg)
Table 5. Summary of Monofrax® K-3 corrosion data by a modified ASTM C621 method tested at 1208°C for 6 days with air bubbling in the glass melt. The average corrosion rate was converted from the reported 6-day corrosion depth at the neck/melt line in inch [Citation126].
Figure 5. Monofrax® K-3 refractory from disassembled scaled melters. (a) PNL-LFCM. Cross-section of the glass discharge showing glass penetration into the refractory brick joints and cracks [Citation61]. (b) DM3300. View of the inside of the melter after the melter lid was removed. Picture shows the plenum refractory, tuckstone (yellow brick on ledge) and the K-3 refractory (black brick). The bubblers and temporary riser can also be seen [Citation135]. (c) DM3300. K-3 glass contact refractory that was broken during the removal process. Picture shows approximately 10 cm (4 inches, the measuring tape is in inch) of loss at the melt line [Citation135]. Reprinted with permission from refs [Citation61] and [Citation135].
![Figure 5. Monofrax® K-3 refractory from disassembled scaled melters. (a) PNL-LFCM. Cross-section of the glass discharge showing glass penetration into the refractory brick joints and cracks [Citation61]. (b) DM3300. View of the inside of the melter after the melter lid was removed. Picture shows the plenum refractory, tuckstone (yellow brick on ledge) and the K-3 refractory (black brick). The bubblers and temporary riser can also be seen [Citation135]. (c) DM3300. K-3 glass contact refractory that was broken during the removal process. Picture shows approximately 10 cm (4 inches, the measuring tape is in inch) of loss at the melt line [Citation135]. Reprinted with permission from refs [Citation61] and [Citation135].](/cms/asset/793e3fac-1788-400e-852c-19221db2ec24/yimr_a_2211469_f0005_oc.jpg)
Table 6. Refractory corrosion data from scaled melter Tests.
Figure 6. Average corrosion rate (neck or melt line corrosion depth per day) as a function of time in SRNL’s crucible tests [Citation60, Citation62, Citation96, Citation99, Citation100] and scaled melter tests [Citation61, Citation66, Citation129, Citation131]. Results of crucible tests with different glass at 1100–1200°C and scaled melter tests are shown, with the rates averaged over time.
![Figure 6. Average corrosion rate (neck or melt line corrosion depth per day) as a function of time in SRNL’s crucible tests [Citation60, Citation62, Citation96, Citation99, Citation100] and scaled melter tests [Citation61, Citation66, Citation129, Citation131]. Results of crucible tests with different glass at 1100–1200°C and scaled melter tests are shown, with the rates averaged over time.](/cms/asset/77a4bbb5-8e50-4264-ac25-09a130c26618/yimr_a_2211469_f0006_oc.jpg)
Figure 7. Corrosion of the Monofrax® K-3 refractory lining of production melters. (a) DWPF Melter 2, reprinted with permission from ref [Citation151]. (b) SRS M-Area DM5000A, reprinted with permission from Ref. [Citation36].
![Figure 7. Corrosion of the Monofrax® K-3 refractory lining of production melters. (a) DWPF Melter 2, reprinted with permission from ref [Citation151]. (b) SRS M-Area DM5000A, reprinted with permission from Ref. [Citation36].](/cms/asset/2705131f-a9fe-44ac-b560-de47774736fb/yimr_a_2211469_f0007_oc.jpg)
Figure 8. Summary of Monofrax® K-3 refractory corrosion data from melter and crucible tests [Citation36, Citation60–62, Citation66, Citation96, Citation99, Citation100, Citation126, Citation129, Citation131, Citation149–151]. The limits of corrosion rate are shown in both of the long-term melter data plot (top, > 300 days) and the short-term crucible data plot (bottom, ≤ 7 days) for comparison. The non-SI unit inch is used in the plots as it is used in all the data source reports. The DWPF design basis of 0.0075 inch/day equals to 191 µm/day and the proposed limit of crucible test of 0.0067 inch/day equals to 169 µm/day. It should be noted that the two DWPF data points are very roughly estimated based on visual inspection of DWPF Melter 1 [Citation149, Citation150] and DWPF Melter 2 [Citation151] after end of their service.
![Figure 8. Summary of Monofrax® K-3 refractory corrosion data from melter and crucible tests [Citation36, Citation60–62, Citation66, Citation96, Citation99, Citation100, Citation126, Citation129, Citation131, Citation149–151]. The limits of corrosion rate are shown in both of the long-term melter data plot (top, > 300 days) and the short-term crucible data plot (bottom, ≤ 7 days) for comparison. The non-SI unit inch is used in the plots as it is used in all the data source reports. The DWPF design basis of 0.0075 inch/day equals to 191 µm/day and the proposed limit of crucible test of 0.0067 inch/day equals to 169 µm/day. It should be noted that the two DWPF data points are very roughly estimated based on visual inspection of DWPF Melter 1 [Citation149, Citation150] and DWPF Melter 2 [Citation151] after end of their service.](/cms/asset/97fbe9bd-e1e0-4713-9343-2314c3a78fff/yimr_a_2211469_f0008_oc.jpg)
Figure 9. Example of empirical models of Monofrax® K-3 corrosion by crucible test. (a) linear mixture model fit. (b) machine learning fit. (c) response trace plot for 13-Term reduced partial quadratic mixture model on the naturallogarithm of melt line corrosion depth. Data adapted from Muller et al. [Citation126], Vienna et al. [Citation127], and Smith-Gray et al. [Citation128]. The non-SI unit inch is used in the plots as it is used in all the data source reports.
![Figure 9. Example of empirical models of Monofrax® K-3 corrosion by crucible test. (a) linear mixture model fit. (b) machine learning fit. (c) response trace plot for 13-Term reduced partial quadratic mixture model on the naturallogarithm of melt line corrosion depth. Data adapted from Muller et al. [Citation126], Vienna et al. [Citation127], and Smith-Gray et al. [Citation128]. The non-SI unit inch is used in the plots as it is used in all the data source reports.](/cms/asset/9f61fef1-b0c2-4854-bfdd-dbd1a0d735cd/yimr_a_2211469_f0009_oc.jpg)
Figure 10. Diagram of dissolution at surface (a) neck corrosion on sample (1: solid, 2: liquid, 3: gas) and (b) Marangoni flow schematic showing development of corrosion groove. Adopted from Hrma [Citation152] and Pötschke and Brüggmann [Citation154].
![Figure 10. Diagram of dissolution at surface (a) neck corrosion on sample (1: solid, 2: liquid, 3: gas) and (b) Marangoni flow schematic showing development of corrosion groove. Adopted from Hrma [Citation152] and Pötschke and Brüggmann [Citation154].](/cms/asset/e145ce9b-e5a5-4b64-ad73-427205f868a8/yimr_a_2211469_f0010_oc.jpg)