Figures & data
Table 1. Baseline demographic and clinical characteristics by BSA-measured disease severity.
Table 2. Baseline demographic and clinical characteristics by BSA-measured psoriasis disease severity and involvement of special areas.
Figure 1. Mean change from baseline in HRQoL and psoriasis symptoms among all patients (N = 2620) by percent improvement in BSA at 6-month follow-up.Change in BSA <0% refers to patients who had either no change or an increase in percent BSA from baseline. *p < 0.001 for trend among response groups. BSA: body surface area; DLQI: dermatology life quality index; PsO: psoriasis; HRQoL: health-related quality of life; SD: standard deviation.
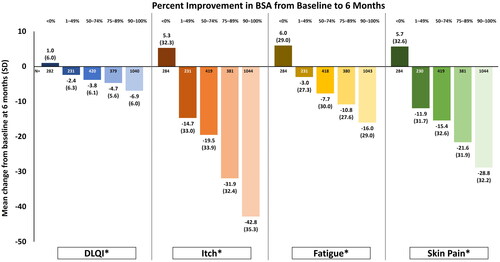
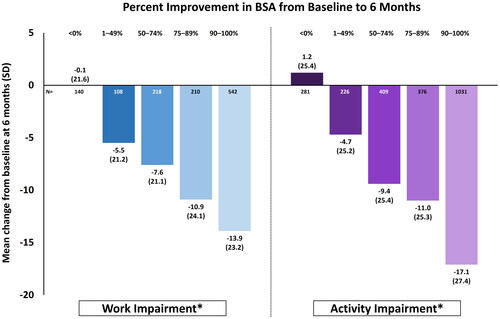
Figure 2. Mean change from baseline in work and activity impairment among all patients (N = 2620) by BSA response at 6-month follow-up. Change in BSA <0% refers to patients who had either no change or an increase in percent BSA. *p < 0.001 for trend among response groups. Work impairment was measured only among those actively employed at baseline (N = 1764). BSA, body surface area; SD, standard deviation.