
Figures & data
Table 1. Patient demographics and medical history at baseline (n = 105).
Figure 1. The transition of peak pruritus-numerical rating scale (PP-NRS) in patients with atopic dermatitis treated with upadacitinib 15 mg/day (n = 105). **p < 0.01 versus week 0, analyzed by friedman’s test.
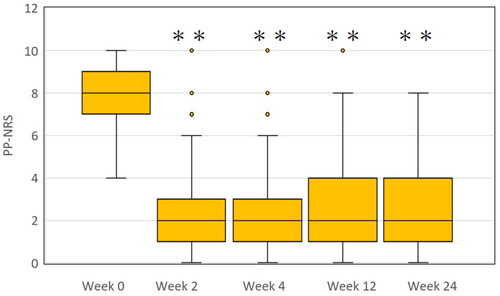
Figure 2. Predictability for week 12 eczema area and severity index (EASI) 100 (a), week 12 investigator’s global assessment (IGA) 0/1 (b), week 24 EASI 100 (c) or week 24 IGA 0/1 (d) by week 2 peak pruritus-numerical rating scale (PP-NRS) value in treatment with upadacitinib 15 mg/day as evaluated by area under the receiver operating characteristic curve (AUC).
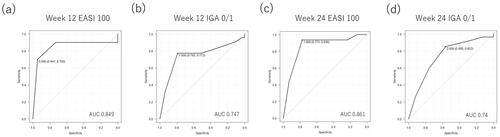
Table 2. Optimal threshold for week 2 PP-NRS response to predict clearance of rash at weeks 12 or 24.
Figure 3. Transition of achievement rates of peak pruritus-numerical rating scale (PP-NRS) ≤ 1 in whole patients (n = 105) and in achievers of week 2 PP-NRS ≤ 1 (n = 35) during treatment with upadacitinib 15 mg/day. **p < 0.01 versus week 0; †p < 0.05, ††p < 0.01 versus week 2; §p < 0.05 versus week 4, analyzed by Fisher’s exact test.
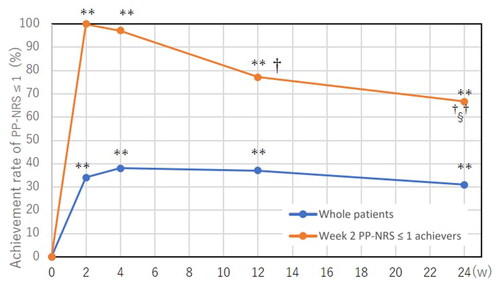
Figure 4. The comparison of achievement rates for eczema area and severity index (EASI) 100 (a), EASI 90 (b), or investigator’s global assessment (IGA) 0/1 (c) between achievers of week 2 PP-NRS ≤ 1 (n = 35) versus non-achievers (n = 70). *p < 0.05, **p < 0.01 versus non-achievers, analyzed by fisher’s exact test.
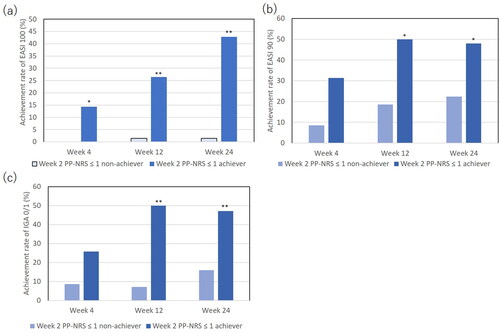
Figure 5. The comparison of eczema area and severity index (EASI) (a), atopic dermatitis control tool (ADCT) (b) and peak pruritus-numerical rating scale (PP-NRS) (c) between achievers of week 2 PP-NRS ≤ 1 (n = 35) versus non-achievers (n = 70). **, p < 0.01 versus non-achievers, analyzed by Mann-Whitney test.
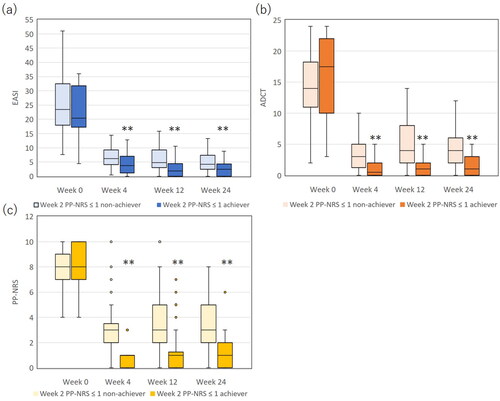
Table 3. The association of each variable with EASI 100 achievement at each time point, analyzed by multiple logistic regression analysis.
Supplemental Material
Download Zip (541.6 KB)Data availability statement
The datasets used and/or analyzed during the current study are available from the corresponding author upon reasonable request.