
Figures & data
Table 1. Demographics and clinical characteristics of the patients.
Figure 1. Improvement in repigmentation in group a across follow-up points.
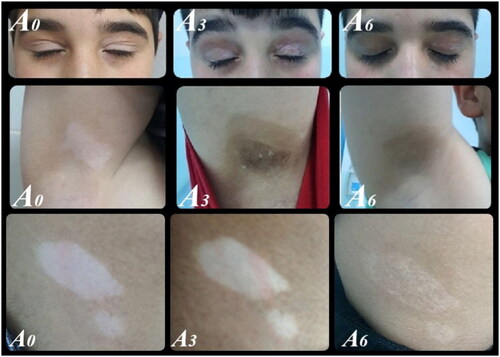
Table 2. Efficacy of each treatment alone and the differences in the efficacy between treatment groups at first, third, and sixth months from baseline.
Figure 2. Excellent improvement after 3 months of treatment in group A.
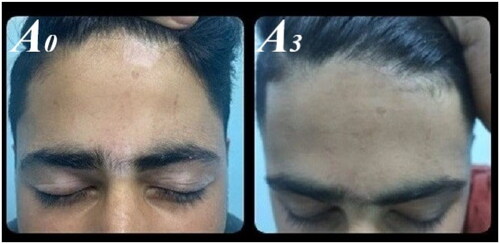
Table 3. The response to treatments according to skin type.
Figure 3. Responses of body sites to treatment A.
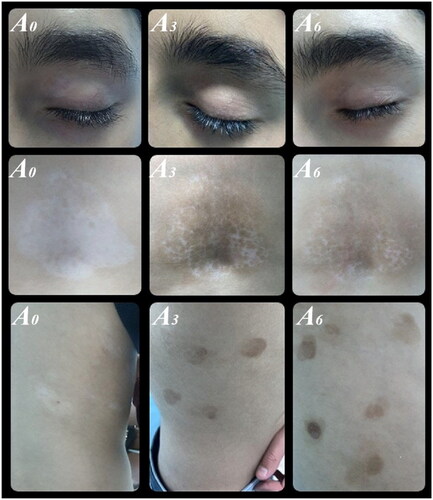
Table 4. Percentages of excellent and moderate responses to treatments among patients as an overall and after categoriztion according to various body sites.
Supplemental material
Supplemental Material
Download PDF (15.7 KB)Data availability statement
Data used in the article are available on request from the corresponding author.