Figures & data
Table 1. Percentage of patients on isotretinoin with labs checked by month.
Table 2. Number of patients with a lab abnormality by month of therapy.
Figure 1. Association between baseline cholesterol and Subsequent Changes in cholesterol Categories.
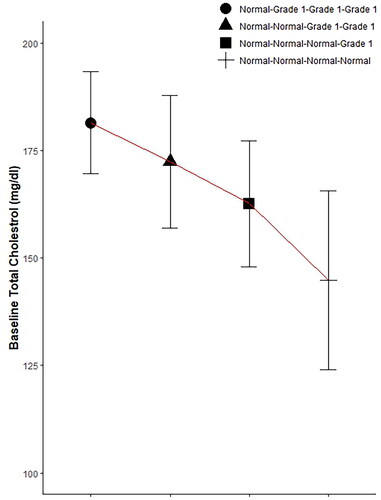
Figure 2. ROC analysis of baseline cholesterol for sensitivity in Screening normal vs. Abnormal follow-up cholesterol levels. AUC: Area under the curve.
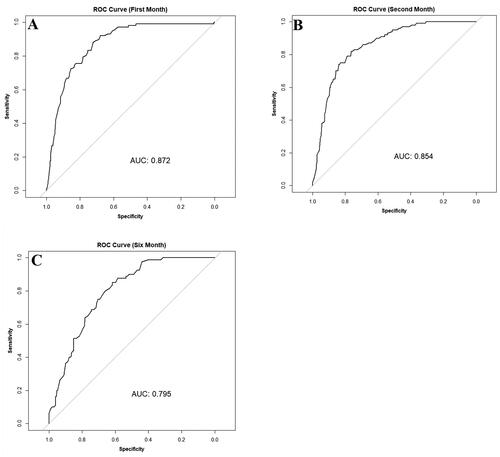
Figure 3. Association between baseline triglycerides levels and Subsequent Changes in triglycerides Categories.
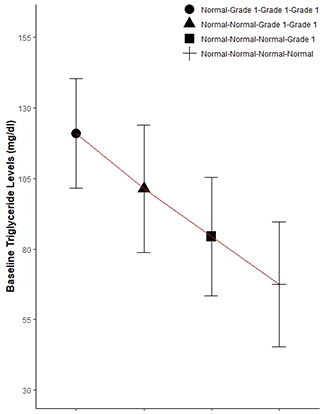
Figure 4. ROC analysis of baseline triglycerides for sensitivity in Screening normal vs. Abnormal follow-up triglycerides levels.
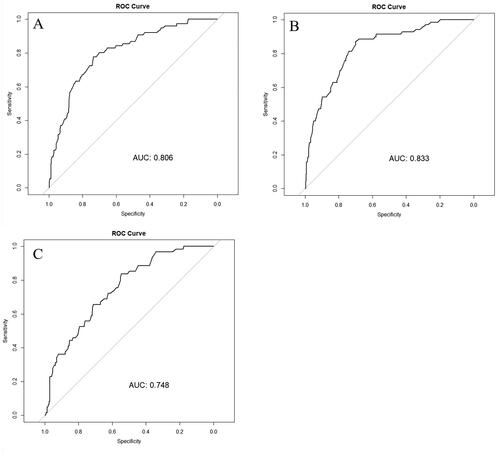
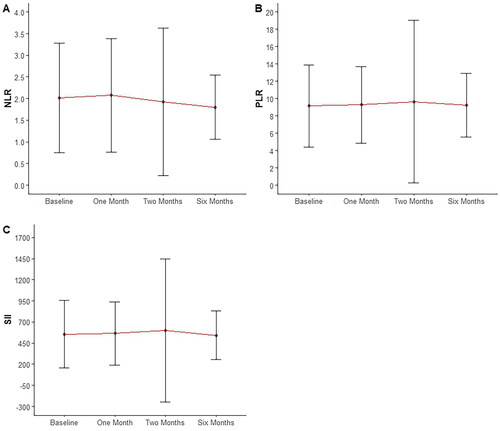
Figure 5. Changes in immune cell ratios across timepoints during isotretinoin treatment.