
Figures & data
Table 1. Attributes and levels for the discrete-choice experiment.
Figure 1. Example discrete-choice experiment questions. (a) Adult and adolescent survey. Please indicate which of the following topical prescription eczema medicines you would choose. (b) Caregiver survey. Please indicate which of the following topical prescription eczema medicines you would choose. Note: Each respondent was presented with 12 choice tasks based on an experimental design of 72 choice tasks, divided into 6 blocks.
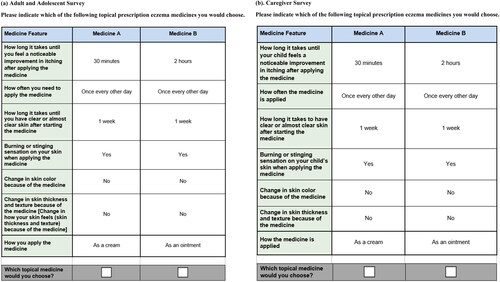
Table 2. Respondent demographic and treatment characteristics.
Table 3. Respondent patient-reported outcome summary scores.
Figure 2. Random-parameters logit model estimates. (a) Adult preference weights (N = 300). (b) Adolescent preference weights (N = 331). (c) Caregiver preference weights (N = 330). DCE: discrete-choice experiment. a ‘Formulation’ was described in patient-friendly language as ‘mode of administration’ in the survey. Notes: Attributes are presented in the order in which they appeared in the DCE questions. The vertical bars around each mean preference weight represent the 95% confidence interval around the point estimate. Because all attribute levels are effects coded, the sum of preference weights across levels of an attribute equals 0. Within each attribute, a higher preference weight indicates that a level is more preferred. For example, on average, adult respondents preferred itch relief in 30 min (weight = 0.663) more than itch relief in 6 h (weight = −0.266). The change in utility associated with a change in the levels of each attribute is represented by the vertical distance between the preference weights for any 2 levels of that attribute. Larger differences between preference weights indicate that respondents viewed the change as having a relatively greater effect on overall utility.
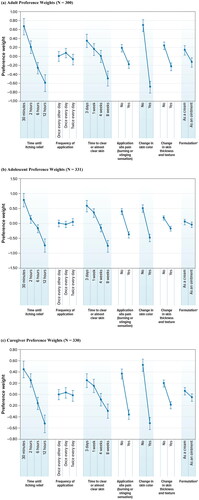
Figure 3. Random-parameters logit model estimates: conditional relative attribute importance. ASP: application site pain; CRI: conditional relative importance; DCE: discrete-choice experiment. a ‘Formulation’ was described in patient-friendly language as ‘mode of administration’ in the survey. Notes: Attributes are presented in the order in which they appeared in the DCE questions. The CRI is the difference between the preference weights on the most influential attribute level and the least influential attribute level. These differences are summed across attributes, and the sum is scaled to 100. The conditional importance of each attribute is a percentage of this total. The standard errors and 95% confidence intervals for these differences were calculated using the delta method. The 95% confidence interval around the point estimate is represented by the black vertical bars on top of the colored bars.
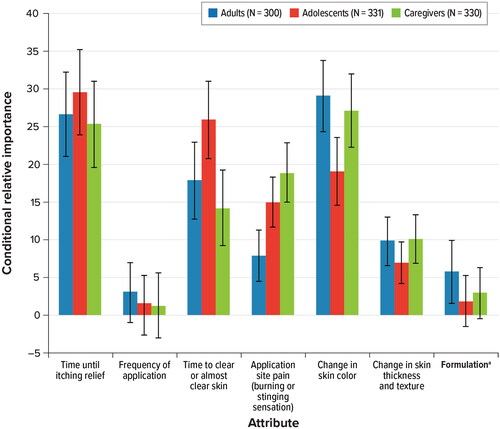
Table 4. Linear regression of outcome PRO variables against selected explanatory variables by cohort.