
Figures & data
Table 1. Baseline demographic and disease characteristics of patients with atopic dermatitis treated with upadacitinib.
Table 2. The clinical indexes at weeks 0, 4, 12, 24, 36, and 48 of upadacitinib 15 mg treatment for patients with atopic dermatitis, and the comparisons between the stages.
Table 3. The clinical indexes at weeks 0, 4, 12, 24, 36 and 48 of upadacitinib 30 mg treatment for patients with atopic dermatitis, and the comparisons between the stages.
Figure 1. Achievement rates of eczema area and severity index (EASI) 75, EASI 90, EASI 100 (a), EASI ≤2, EASI ≤1 (b), investigator’s global assessment (IGA) 0/1, atopic dermatitis control tool 7 (ADCT 7), peak pruritus numerical rating scale 4 (PP-NRS 4) (c), during upadacitinib 15 mg or 30 mg treatment in patients with atopic dermatitis (n = 216, or 71, respectively).
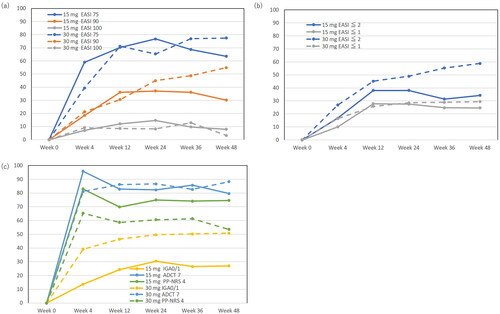
Table 4. Treatment-emergent adverse events (TEAEs) during 48-week treatment with upadacitinib 15 mg or 30 mg in patients with atopic dermatitis.
Data availability statement
The datasets used and/or analyzed during the current study are available from the corresponding author upon reasonable request.