Figures & data
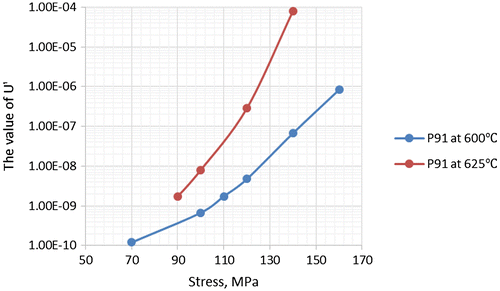
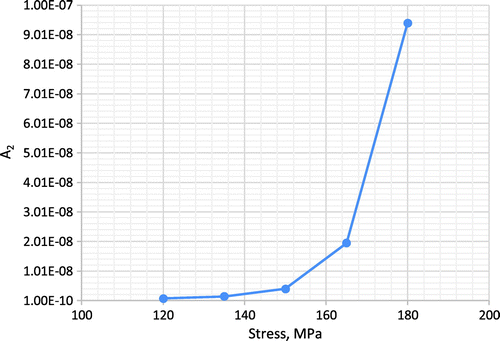
Table 1. The variation of creep cavitation coefficient A [Citation5].
Figure 1. The variation of creep cavitation coefficient A with different variations of stress and temperature [Citation6].
![Figure 1. The variation of creep cavitation coefficient A with different variations of stress and temperature [Citation6].](/cms/asset/c2227f70-dd89-45d5-8791-8d381e90bfef/ymht_a_1388603_f0001_oc.gif)
Figure 2. Comparison of conventional hyperbolic sine law with experiment [Citation8] for 2·25Cr–1Mo steel [Citation9].
![Figure 2. Comparison of conventional hyperbolic sine law with experiment [Citation8] for 2·25Cr–1Mo steel [Citation9].](/cms/asset/36d95a96-c2eb-4aea-b3ab-ea5229c0b8de/ymht_a_1388603_f0002_oc.gif)
Figure 3. Comparison of conventional hyperbolic sine law with experiment [Citation10] for 0·5Cr–0·5Mo–0·25 V steel [Citation9].
![Figure 3. Comparison of conventional hyperbolic sine law with experiment [Citation10] for 0·5Cr–0·5Mo–0·25 V steel [Citation9].](/cms/asset/98ef6142-8ea9-431d-aa3e-08eb72545305/ymht_a_1388603_f0003_oc.gif)
Figure 4. Comparison of modified hyperbolic sine law with the conventional one and experimental data [Citation8] of 0·5Cr–0·5Mo–0·25 V steel [Citation9].
![Figure 4. Comparison of modified hyperbolic sine law with the conventional one and experimental data [Citation8] of 0·5Cr–0·5Mo–0·25 V steel [Citation9].](/cms/asset/eb4fdf61-20ea-41d4-9e51-740cc3d4412c/ymht_a_1388603_f0004_oc.gif)
Figure 5. Comparison of modified hyperbolic sine law with the conventional one and experimental data [Citation10] of 2·25Cr–1Mo steel [Citation9].
![Figure 5. Comparison of modified hyperbolic sine law with the conventional one and experimental data [Citation10] of 2·25Cr–1Mo steel [Citation9].](/cms/asset/156926d3-f589-492a-a28c-4b7b0bc206d5/ymht_a_1388603_f0005_oc.gif)
Table 2. The typical functions between minimum creep strain rate and stress [Citation14].
Figure 6. Experimental data of minimum strain rate and stress at 600 °C under 70–200 MPa for P91 steel [Citation11].
![Figure 6. Experimental data of minimum strain rate and stress at 600 °C under 70–200 MPa for P91 steel [Citation11].](/cms/asset/8d89591c-a37f-41dd-9b1f-d45047324d49/ymht_a_1388603_f0006_oc.gif)
Figure 7. The modelling result of conventional hyperbolic sine law compared with experimental data of P91 steel.
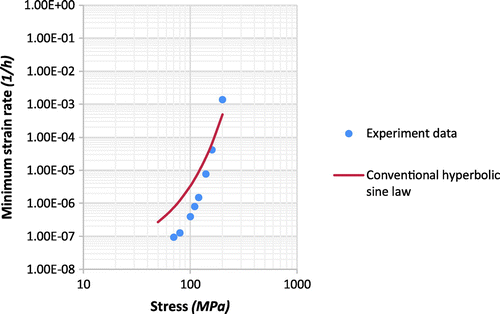
Figure 9. The modelling result of modified hyperbolic sine law compared with experimental data for P91 steel.
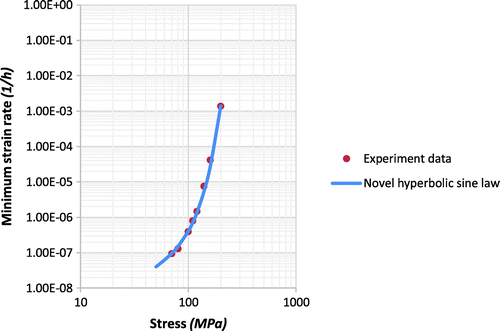
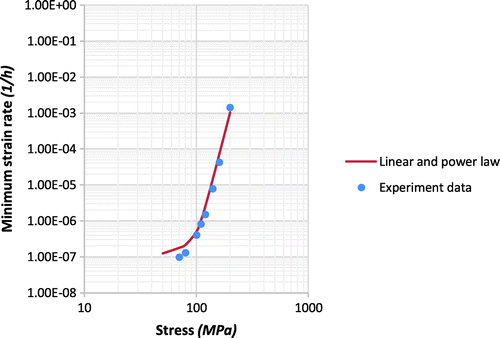
Figure 10. The comparison between different function of minimum creep strain rate and applied stress for P91 steel.
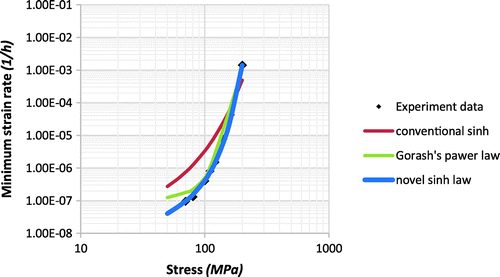
Figure 11. Probability density function of cavity equivalent R for P91, experimental data from ref [Citation21].
![Figure 11. Probability density function of cavity equivalent R for P91, experimental data from ref [Citation21].](/cms/asset/6dfe28a7-93b1-4bab-9a9e-80f402eb2c07/ymht_a_1388603_f0011_oc.gif)

