Figures & data
Figure 1. Process of the systematic review of literature for studies of coffee production areas.
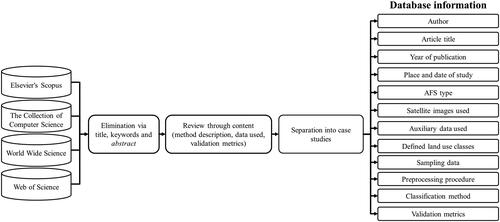
Figure 2. Types of coffee agroforestry systems defined for the review.
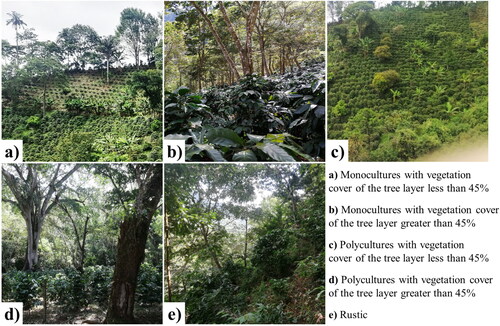
Table 1. Classification of AFS mapping approaches.
Figure 3. Map of the studies selected by country.
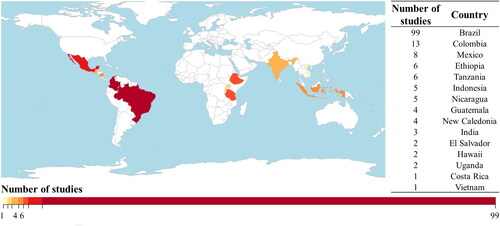
Table 2. Case studies by type of AFS found.
Figure 4. Algorithms identified for the classification of coffee agroforestry systems. ML = Maximum likelihood; RF = Random Forest; KNN = K-Nearest neighbor; CART = classification and regression tree; SMA = Spectral Mixture Analysis; ANN = artificial neuronal network; ISOSEG = per-field clustering classifier; OBIA = object-based Image Analysis; SVM = Support Vector Machine; LMNL = Multinomial Logit; ISODATA = iterative Self-Organizing data Analysis; ECHO = extraction and classification of homogeneous objects; MD = Minimum distance.
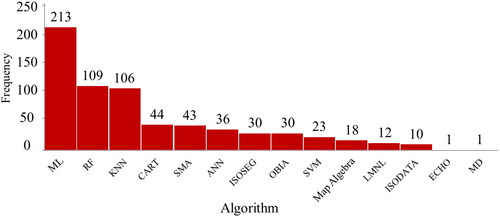
Table 3. Case studies by type of mapping approaches.
Table 4. Frequency of identified satellite images.
Table 5. Auxiliary data used in case studies.
Table 6. Case studies classified by reported accuracy evaluation metrics.
Figure 5. Distribution of accuracies reported by type of agroforestry system. (a) Global accuracy, (b) producer accuracy and (c) user accuracy.
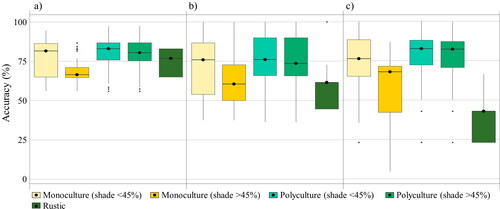
Table 7. Analysis of variance by type of AFS and producer accuracy reported.
Figure 6. Producer accuracy for mapping shaded monocultures (shade 45%) by algorithm.
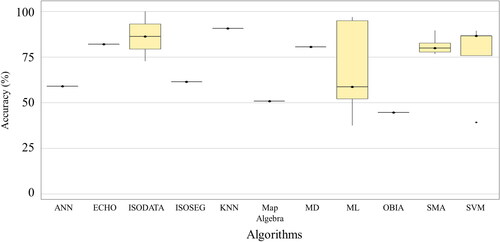
Figure 7. Analysis of variance and producer accuracy by (a) whether it use training data, (b) analysis unit and (c) whether it use statistical parameters for mapping monocultures (shade 45%).
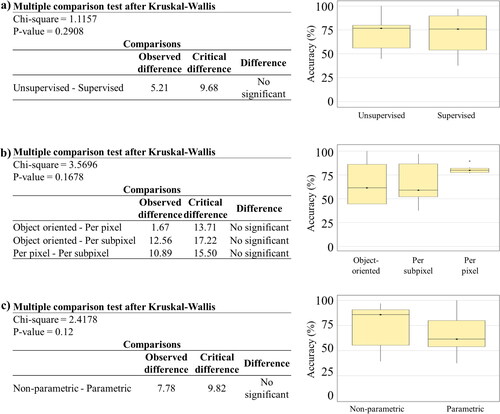
Figure 8. Producer accuracy for mapping shaded monocultures (shade 45%) by sensor type.
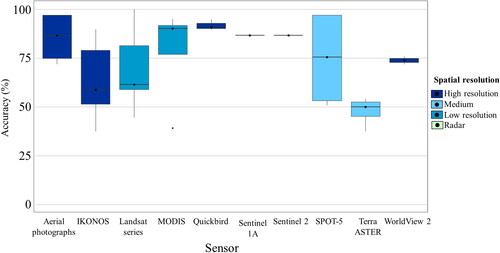
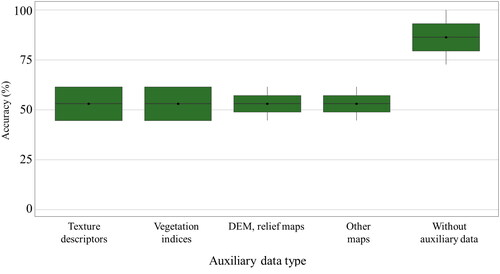
Figure 9. Auxiliary information used for the classification of monocultures (shade 45%).
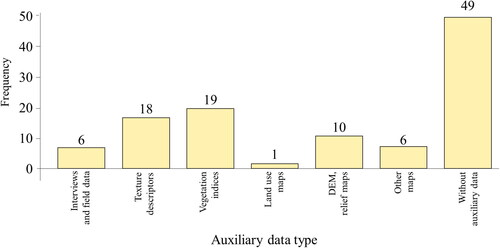
Table 8. Analysis of variance by spatial resolution and producer accuracy achieved for mapping of monocultures (shade 45%).
Figure 10. Reported producer accuracy for coffee monoculture (shade 45%) by algorithm type.
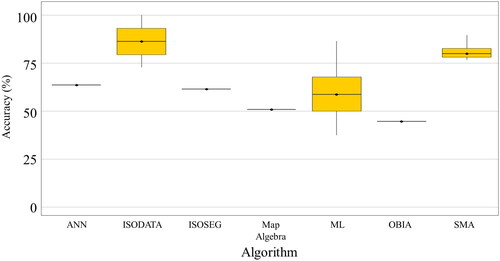
Figure 11. Analysis of variance and producer accuracy by a) type of classification, b) analysis unit and c) whether it use statistical parameters for mapping coffee monocultures (shade 45%).
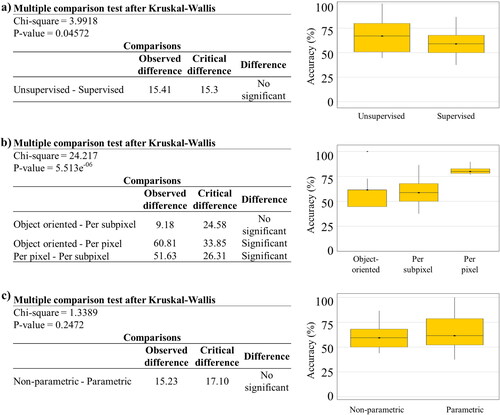
Figure 12. Reported producer accuracy for monocultures (shade 45%) by sensor type.
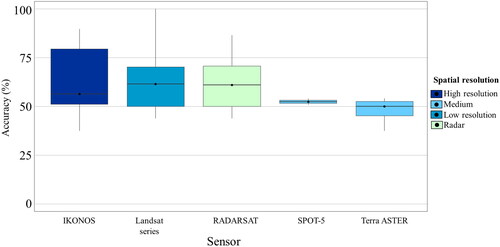
Table 9. Analysis of variance by spatial resolution of the images used and produces accuracy achieved for monocultures (shade 45%).
Figure 13. Auxiliary information used for the classification of monocultures (shade 45%).
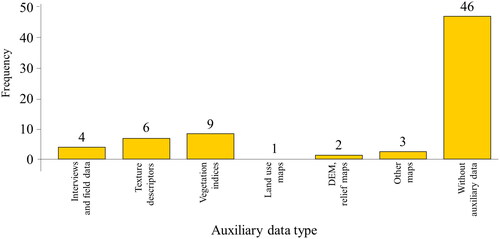
Figure 14. Distribution of producer accuracy values reported for polyculture mapping by algorithm.
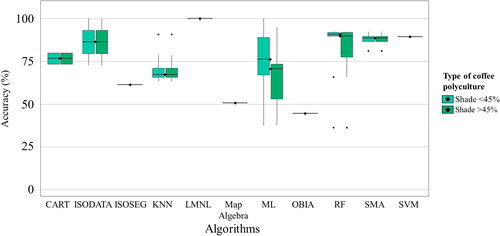
Figure 15. Distribution of producer accuracy values reported for polyculture mapping by algorithm type: a) by supervised or unsupervised classification, b) by analysis unit, and c) whether it is possible to adjust algorithm parameters.
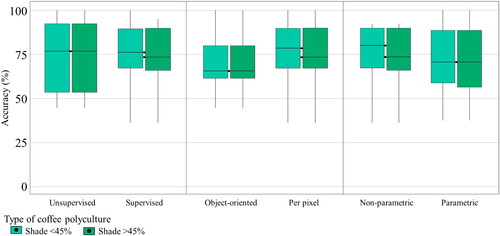
Figure 16. Kruskal-Wallis analysis of variance for supervised and unsupervised classification for mapping polycultures with different shade coverage percentages.

Figure 17. Kruskal-Wallis analysis of variance for object-oriented and per-pixel classifications for mapping polycultures with different shade coverage percentages.
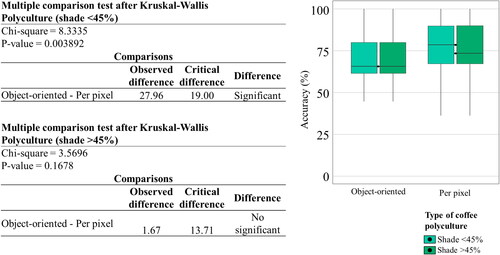
Figure 18. Kruskal-Wallis analysis of variance for parametric and non-parametric algorithms for mapping polycultures with different shade coverage percentages.
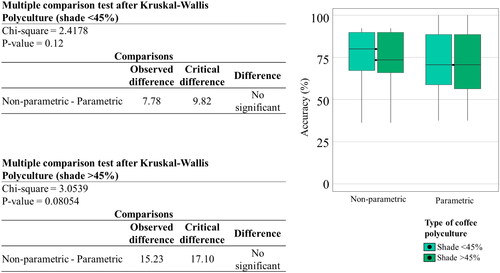
Figure 19. Producer accuracy reported for polycultures by sensor type.
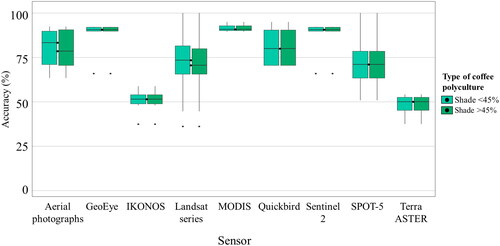
Figure 20. (a) Producer accuracy reported by type of auxiliary data used and (b) number of case studies by type of auxiliary data used for polycultures (shade 45%); and (c) global accuracy reported by type of auxiliary data used and (d) number of case studies by type of auxiliary data used for polycultures (shade
45%).
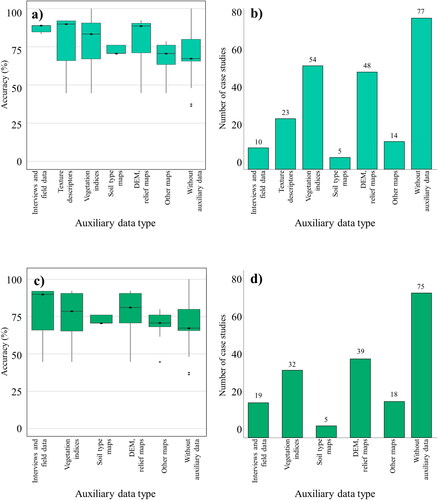
Figure 21. Producer accuracy reported for mapping of rustic systems by a) algorithm, b) by supervised or unsupervised classification, c) by analysis unit and d) whether it is possible to adjust algorithm parameters.
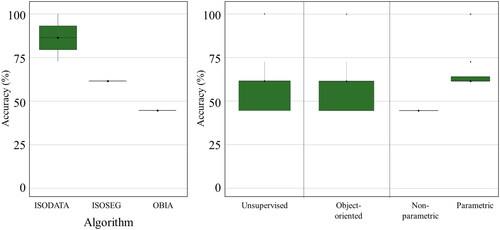
Table 10. Analysis of variance of parametric and non-parametric algorithms and producer accuracy reported for mapping of rustic AFS mapping.
Figure 22. Producer accuracy for mapping rustic systems by type of auxiliary data used.