
Figures & data
Table 1a. Published Ramazzini Institute (RI) studies in SD rats.
Table 1b. Published Ramazzini Institute (RI) studies in Swiss mice.
Table 2. Variability of tumor incidence from SD rats dietary and drinking water studies.
Table 3. Summary statistics for tumors of interest across RI control groups in SD rats for studies conducted between 1987 and 2006 (oral route of administration).
Figure 1. Incidence of lymphomas and leukemias in control SD male rats.
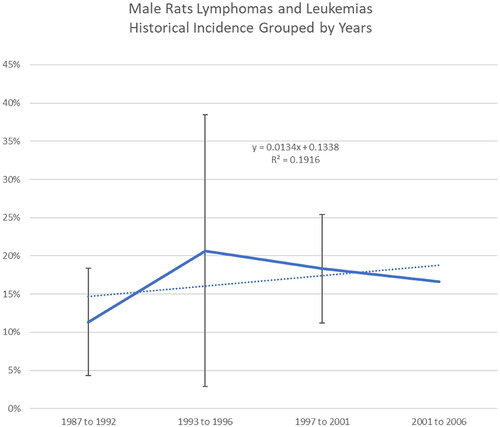
Figure 2. Incidence of lymphomas and leukemias in control female SD rats.
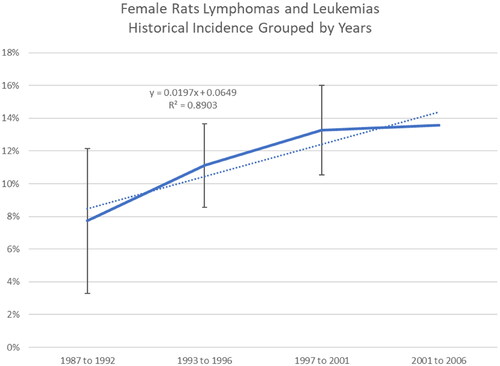
Figure 3. Incidence of total malignant tumor in female SD rats.
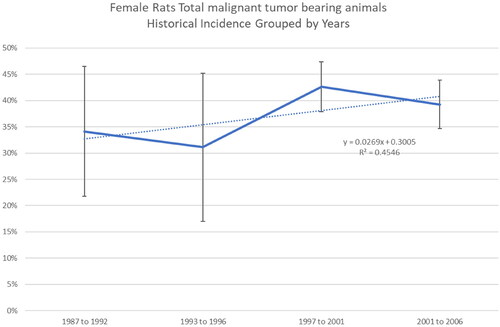
Table 4. Comparative analyses of tumor incidence reported in RI control groups of SD rats.
Table 5a. Comparative analyses of percent tumor incidence in SD rats between RI aspartame-treated groups and RI control dataset.
Table 5b. Comparative analyses of percentage of SD rats between RI aspartame treated groups and RI control dataset for studies conducted from 1992 to 1997.
Table 5c. Comparative analyses of percentage of SD rats between RI aspartame treated groups and RI control dataset for studies conducted from 1997 to 2006.
Table 5d. Comparative analyses of percentage of SD rats between RI aspartame treated groups and RI control dataset for studies conducted from 1992 to 2006.
Table 6a. Comparative analyses of percent tumor incidence in SD rats between RI formaldehyde-treated groups and RI control dataset.
Table 6b. Comparative analyses of percent tumor incidence in SD rats between RI formaldehyde-treated groups and RI control dataset from 1992 to 1997.
Table 6c. Comparative analyses of percent tumor incidence in SD rats between RI formaldehyde-treated groups and RI control dataset from 1997 to 2006.
Table 6d. Comparative analyses of percent tumor incidence in SD rats between RI formaldehyde-treated groups and RI control dataset from 1992 to 2006.
Table 7a. Comparative analyses of percent tumor incidence in SD rats between RI methyl alcohol-treated groups and RI control dataset.
Table 7b. Comparative analyses of percent tumor incidence in SD rats between RI methyl alcohol-treated groups and RI control dataset from 1992 to 1997.
Table 7c. Comparative analyses of percent tumor incidence in SD rats between RI methyl alcohol-treated groups and RI control dataset from 1997 to 2006.
Table 7d. Comparative analyses of percent tumor incidence in SD rats between RI methyl alcohol-treated groups and RI control dataset from 1992 to 2006.
Table 8. Summary statistics for relevant tumor incidence across RI control groups in Swiss mice.
Table 9. Comparative analyses of percent tumor incidence in Swiss mice between RI aspartame-treated groups and RI control dataset.
Table 10. Comparative analyses of percent tumor incidence in Swiss mice between RI sucralose-treated groups and RI control dataset.