Figures & data
Table 1. Primary antibodies.
Table 2. Characteristics of subjects in the normotensive pregnant and pre-eclamptic groups.
Figure 1. Expression of antibodies directed against NEDD4L, α-ENaC and γ-ENaC on Western blot in normotensive pregnant controls (NP, n = 17) and pre-eclamptic patients (PE, n = 19) normalized to spot urine creatinine (mmol/L). Data are presented as scatter plots, with each patient’s densitometry value represented as a dot and the horizontal line is the median of the sample. (a) A representative Western blot of four NP patients and four PE patients with antibodies against NEDD4L, α-ENaC, and γ-ENaC, as well as vesicle markers TSG101 and CD9. (b) Densitometry analysis of NEDD4L (110 and 130kDa bands) showed no difference between the two groups (p = 0.17). (c) The 30kDa band of α-ENaC was quantified. Densitometry analysis did not show a significantly increased expression of α-ENaC in PE group compared to NP (p = 0.10). (d) For γ-ENaC, the 70kDa band was quantified. Densitometry analysis showed a 6.9-fold increased expression of γ-ENaC in PE group compared to NP (p < 0.0001). (e) Percentage of α-ENaC expression in NP and PE groups. (f) Percentage of γ-ENaC expression in NP and PE groups.
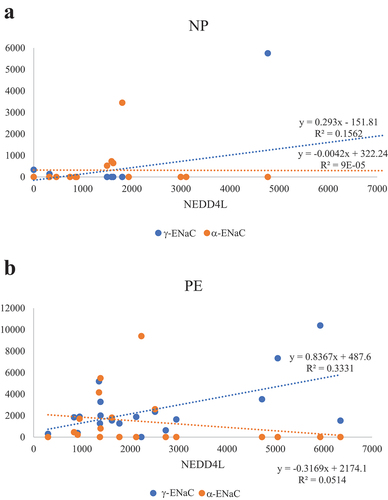
Figure 2. Regression analyses of NEDD4L with detectable α-ENaC and γ-ENaC in normotensive pregnant controls (NP) and pre-eclamptic patients (PE). (a) In the normotensive pregnant group, there were no significant correlations between NEDD4L and α-ENaC (p = 0.97), as well as NEDD4L and γ-ENaC (p = 0.12). (b) In the pre-eclampsia group, there was a significant correlation between Nedd4-2 and γ-ENaC (p = 0.01) but not with NEDD4L and α-ENaC (p = 0.35). Patients without detectable ENaC were not included in the regression analysis.