
Figures & data
Table 1. Baseline characteristics of the virtual placenta study population.
Figure 1. Correlations by Spearman Rank test between maternal telomere length (T/S ratio) and a) renin, b) prorenin, c) aldosterone.
Table 2. The associations between first-trimester log-transformed RAAS component concentrations at week 9 of pregnancy and telomere length at 20 weeks of pregnancy.
Figure 2. Box-and-whisker plot demonstrating the distribution of telomere length (TS ratio) in the natural conceived group compared with the IVF/ICSI group. Boxplots present median, 10th, 25th, 75th, and 90th percentile. Telomere length was compared by Mann-Whitney U test. *Significance at p < 0.05.
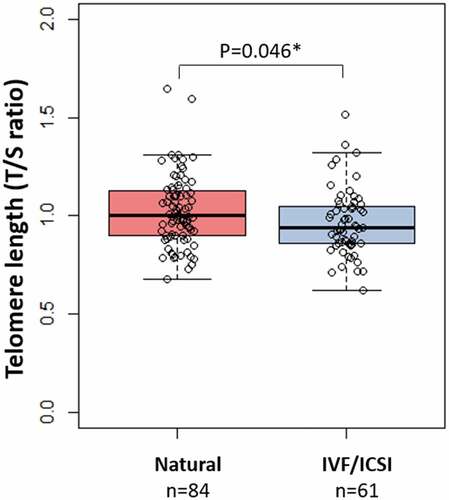
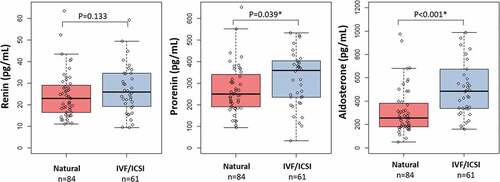
Figure 3. Box-and-whisker plot demonstrating the distribution of renin, prorenin and aldosterone concentrations in the natural conceived group compared with the IVF/ICSI group. Boxplots present median, 10th, 25th, 75th, and 90th percentile. Renin, prorenin and aldosterone concentrations were compared by Mann-Whitney U test. *Significance at p < 0.05.
Supplemental Material
Download MS Word (16.7 KB)Data availability statement
The data that support the findings of this study are available from the corresponding author, DAF, upon reasonable request.