
Figures & data
Figure 1. PRISMA flow diagram: preferred reporting items for systematic reviews and meta-analyses.
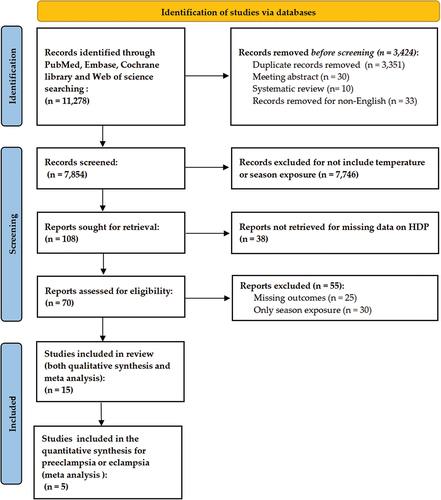
Table 1. Characteristics of the included studies on ambient temperature and HDP.
Table 2. Summary of temperature exposure data, statistical methods and results.
Figure 2. Analysis of the associations between heat exposure and HDP by the gestational weeks of pregnancy. Green shading indicates the period of increased risk during pregnancy after heat exposure. Orange shading indicates the studies that showed a decreased risk. Yellow shading indicates that heat exposure and HDP have no association.
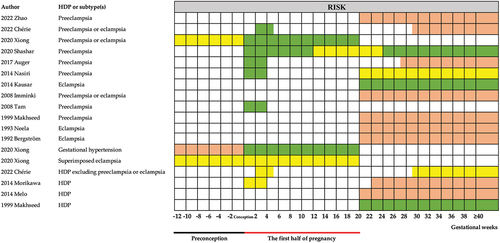
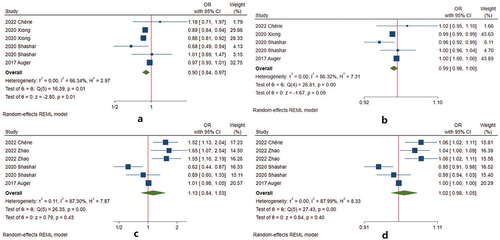
Figure 3. Meta-analysis of the associations between heat exposure and preeclampsia or eclampsia by the gestational weeks of pregnancy. (a) heat temperature during w1–20 vs. reference temperature; (b) 1°Cincrease during w1–20 vs. reference temperature; (c) heat temperature after 20 weeks of gestation vs. reference temperature; (d) 1°Cincrease during after 20 weeks of gestation vs. reference temperature.
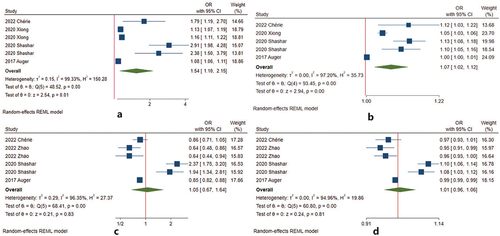
Table 3. Meta-analysis results between extreme temperature exposure and preeclampsia or eclampsia during the gestational weeks.
Figure 4. Analysis of the associations between cold exposure and HDP by the gestational weeks of pregnancy. Green shading indicates the period of increased risk during pregnancy after cold exposure. Orange shading indicates the studies that showed a decreased risk. Yellow shading indicates that the temperature and HDP have no association.
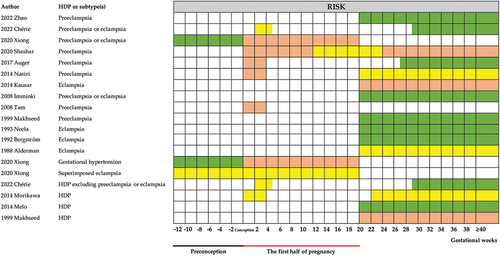
Figure 5. Meta-analysis of the associations between cold exposure and preeclampsia or eclampsia by the gestational weeks of pregnancy. (a) cold temperature during w1–20 vs. reference temperature; (b) 1°Cdecrease during w1–20 vs. reference temperature; (c) cold temperature after 20 weeks of gestation vs. reference temperature; (d) 1° decrease during after 20 weeks of gestation vs. reference temperature.
Supplemental Material
Download Zip (169.6 KB)Data availability statement
Data sharing is not applicable to this article because there is no new data was created or analyzed.