
Figures & data
Figure 1. Schematic of the preparation of activated biocarbon.
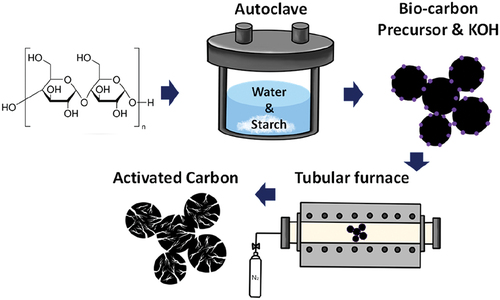
Figure 2. SEM images of biocarbons (a) synthesized by a hydrothermal reaction for 12 h (before activation) and (b – d) after activation at (b) 700, (c) 800, and (d) 900 °C. (e) N2 sorption isotherms and (f) pore-size distributions of activated biocarbons.
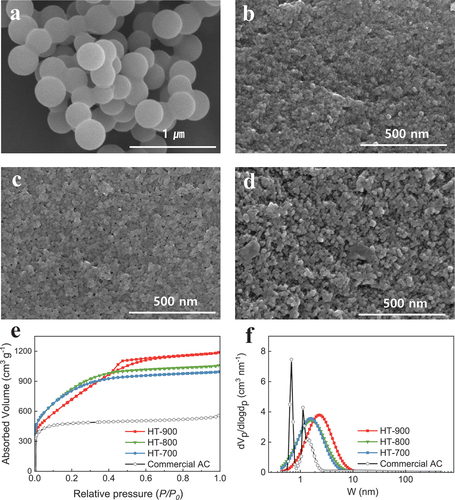
Figure 3. (a) X-ray diffraction patterns, (b) Raman spectroscopy, and (c) thermogravimetric profiles of non-activated biocarbon (HT) and activated biocarbons (HT-700, HT-800, HT-900).
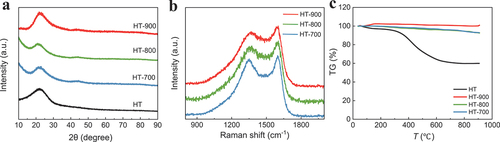
Figure 4. CV curves for activated biocarbon electrodes of HT-700, HT-800, and HT-900 at different scan rates: (a) 1, (b) 50, and (c) 200 mV s−1. (d) Variation in specific capacitance from the CV curves (a – c). (e) AC impedance and (f) cyclic stability of HT-900 at 200 mV s−1.
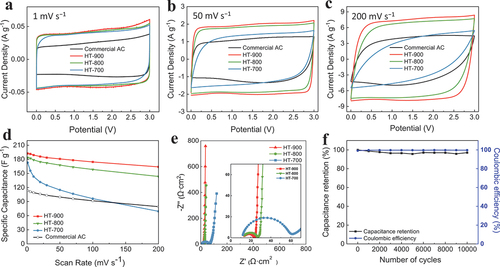
Figure 5. Galvanostatic charge and discharge curves for the activated biocarbon electrodes of HT-700, HT-800, HT-900, and commercial AC at different current densities of (a) 0.5 and (b) 5 A g−1. (c) Variation in specific capacitance from the GCD curves.
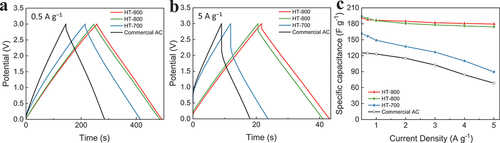
Figure 6. Ragone plot of the specific energy density versus specific power density for activated biocarbons compared with the values for other ACs [Citation24,Citation26–28].
![Figure 6. Ragone plot of the specific energy density versus specific power density for activated biocarbons compared with the values for other ACs [Citation24,Citation26–28].](/cms/asset/597fc603-6f45-4fa3-b9bc-684f6a475755/ymte_a_2338628_f0006_oc.jpg)