Figures & data
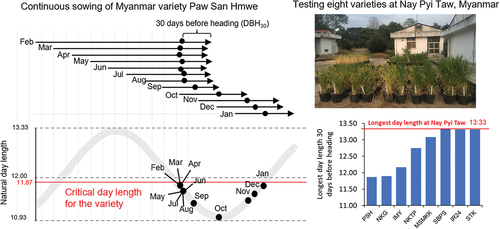
Table 1. List of plant materials used in this study.
Figure 1. Definitions of the measures for characterization of heading date in this study. The details are described in the materials and methods section.
Figure 2. Heading date and days to heading (DTH) of eight tested varieties sown on different dates throughout the year. The numbers indicate the varieties’ DTH. The months where the shortest DTH was detected are underlined and in bold text.
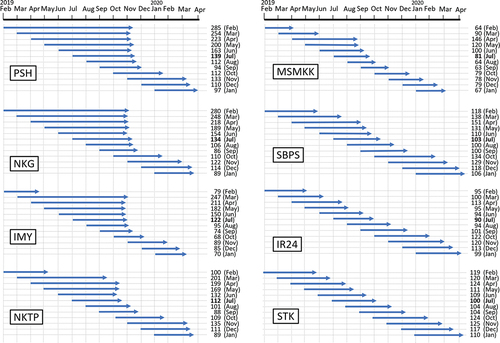
Table 2. Days to heading under short-day treatment during the dry season from December 2019 to April 2020.
Table 3. Days to heading under short-day treatment in the 2020 monsoon season from July to November 2020.
Figure 3. Critical day length of eight tested varieties. The grey curves indicate the day length at Nay Pyi Taw from February 2019 to April 2020. Small dots were plot of the varities sown at each month. The dots are drawn at the date for 30 days before heading (DBH30) in a horizontal axis and day length at date for 30 days before heading (DL30) in a vertical axis. The longest DL30 are defined as the critical day lengths for each variety (red line).
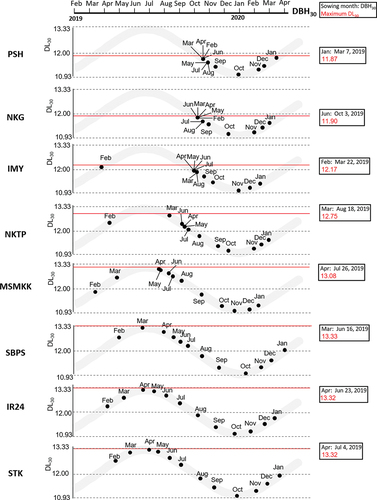
Figure 4. DVI models of the April to July sowing times constructed using the NK05 and CDL models. (a,b) regression of the predicted DTH by the observed DTH to show the accuracy of prediction in the eight varieties in the NK05 (a) and CDL (b) models. (c) The adjusted coefficient of the determinant (R2) in each tested variety on the short-term DVI models. (d,e) R2 in each tested variety on the long-term DVI models using data of sowing from February 2019 to January 2020 (d) and data of sowing from February to November 2019. Grey and black bars represent the NK05 and CDL models, respectively.
Table 4. The adjusted coefficient of determinant R2 of the predicted DTH regressed by the observed DTH in four month sowing period throughout a year.
Supplemental Material
Download PDF (749.6 KB)Supplemental Material
Download MS Excel (30.4 KB)Data availability statement
The data used to support the findings of this study have been included in this article.