
Figures & data
Table 1. Ameliorative effect of zinc on acrylamide-impaired sperm parameters.
Table 2. Ameliorative effect of zinc on acrylamide-impaired sperm motility
Figure 1. Photomicrograph showing the histoarchitecture changes, Sertoli cell count, Leydig cell count, Germ cell count, Diameter of the seminiferous tubules, Luminal diameter, and Epithelial height of the testis. Control group revealed normal arrangement of the seminiferous tubules epithelium, clusters of sperm cells at the lumen, statistical significant increase in germ cell and Sertoli cell (**p < 0.001), and statistically significant increase in the number of Leydig cells (*p < 0.001). AA group revealed severe degeneration of seminiferous tubules epithelium, loss of sperm cells at the lumen, and degeneration of the interstitial cells. Significant decrease in germ cell, Sertoli cell and Leydig cell count (*p < 0.001) when compared with the control group. There was also a significant increase in the luminal diameter and epithelial height when compared to other group (*p < 0.001). AA + LZ group revealed moderate degeneration of seminiferous tubules epithelium, loss of sperm cells at the lumen and statistically significant increase in the Leydig cells, Sertoli cells and germ cells count when compared with the AA group (*p < 0.001, **p < 0.01). There was also a significant reduction in luminal diameter and epithelial height when compared with AA group (*p < 0.001, **p < 0.01). AA + HZ group revealed moderate loss of seminiferous tubules epithelium, statistical increase in interstitial cells, germ cell, and Sertoli cell when compared with AA group (**p < 0.001), and a significant reduction in the luminal diameter when compared with AA group. (Black arrow: Leydig cells, Green arrow: myoid cells, GE: Germinal epithelium, L: Lumen, S: Spermatids.) Photomicrograph at x800 magnification, using H&E staining.
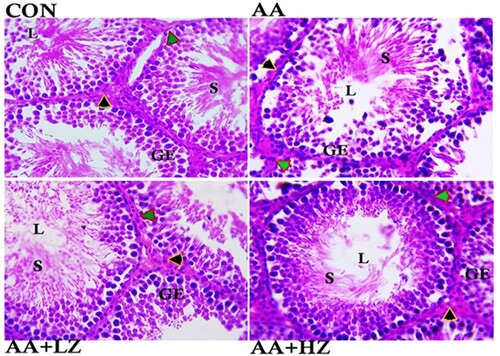
Figure 2. Effect of AA on (A) germ cell count (B) Leydig cell count (C) Sertoli Cell count (D) seminiferous diameter (E) epithelial height (F) luminal diameter. Data were analyzed using one-way analysis of variance (ANOVA), which was then followed by Tukey's multiple post hoc test and level of significance was determined at p < 0.05. CON, AA, LZ, and HZ are referred to as control, acrylamide, zinc low dose, zinc high dose respectively.
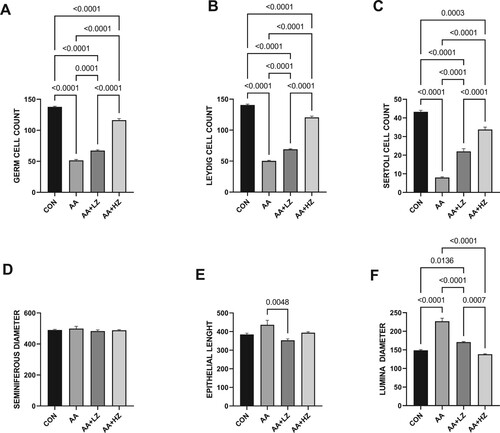
Figure 3. Effect of AA on (A) FSH (B) LH (C) testosterone (D) GnRH. Data were analyzed using one-way analysis of variance (ANOVA), which was then followed by Tukey's multiple post hoc test and level of significance was determined at p < 0.05. CON, AA, LZ, and HZ are referred to as control, acrylamide, zinc low dose, zinc high dose respectively
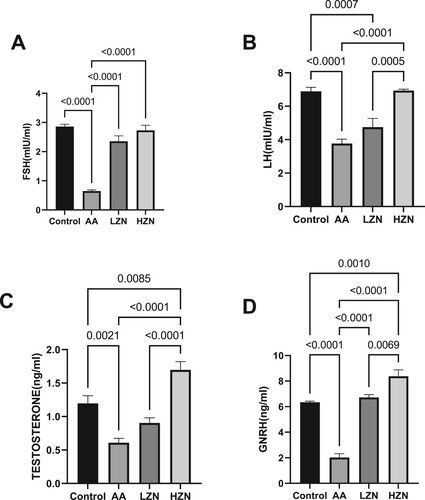
Figure 4. Effect of AA on testicular (A) MDA (B) total catalase-like activities (C) total SOD-like activities (D) NRF-2 (E) HMO-1. The values for the quantified bands of the specified genes from each sample in the five groups were expressed as means ± SEM, where n = 6. Data were analyzed using one-way analysis of variance (ANOVA), which was then followed by Tukey's multiple post hoc test and level of significance was determined at p < 0.05. CON, AA, LZ, and HZ are referred to as control, acrylamide, zinc low dose, zinc high dose respectively
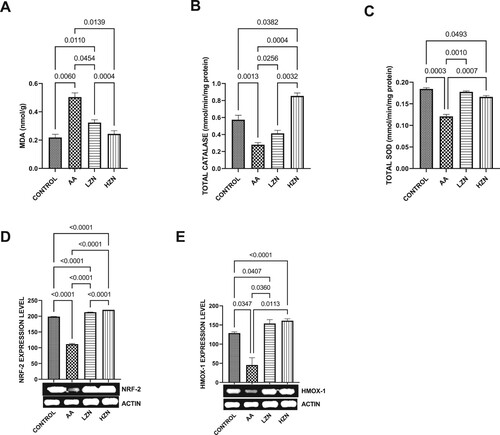
Figure 5. Effect of AA on testicular (A) IL-1B (B) NFK-B. The values for the quantified bands of the specified genes from each sample in the five groups were expressed as means ± SEM, where n = 6. Data were analyzed using one-way analysis of variance (ANOVA), which was then followed by Tukey's multiple post hoc test and level of significance was determined at p < 0.05. CON, AA, LZ, and HZ are referred to as control, acrylamide, zinc low dose, zinc high dose respectively.
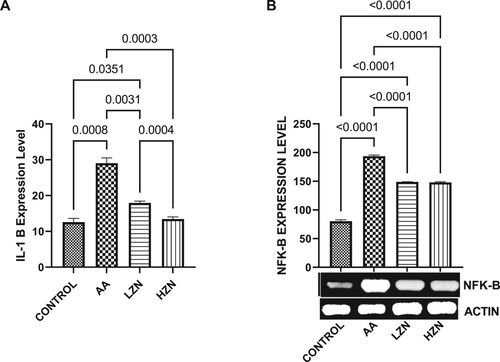
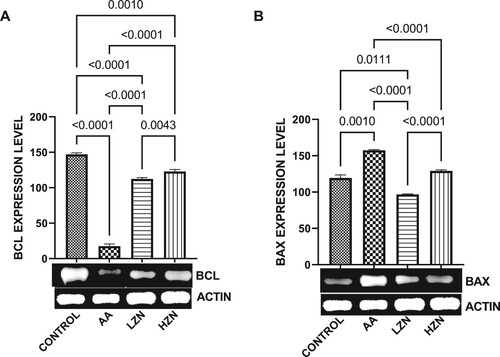
Figure 6. Effect of AA on the testicular expression of (A) BCL2 (B) BAX. The values for the quantified bands of the specified genes from each sample in the five groups were expressed as means ± SEM, where n = 6. Data were analyzed using one-way analysis of variance (ANOVA), which was then followed by Tukey's multiple post hoc test and level of significance was determined at p < 0.05. CON, AA, LZ, and HZ are referred to as control, acrylamide, zinc low dose, zinc high dose respectively.
Data availability statement
The materials for the manuscript, including any relevant raw data, will be freely made available by the corresponding author (Odetayo Adeyemi Fatai) to any researcher who needs them for non-commercial study while protecting participant confidentiality.