
Figures & data
Figure 1. Metabolomics analysis and GO biology process (BP) enrichment of RNA-seq-based transcriptome of skeletal muscle in CthΔskm mice. The CthΔskm and littermate Cthf/f mice were house under standard condition until 17 weeks old, and then sacrificed under deep anesthesia. GAS was obtained for quasi-metabolomics analysis and RNA-seq analysis. (A), volcano plot of differential metabolites (p < 0.05 and VIP > 1) between CthΔskm and Cthf/f mice (n = 8 in each group). (B), the composition of differential metabolites in skeletal muscle. (C), KEGG enrichment analysis of metabolomics between CthΔskm and Cthf/f mice. (D), Metabolic pathways in RNA-seq GO:BP enrichment between CthΔskm and Cthf/f mice.
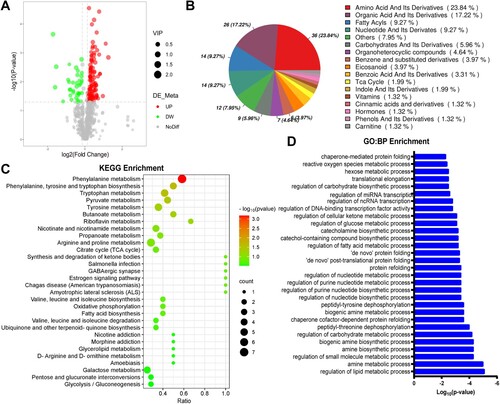
Figure 2. Energy metabolism was reduced in skeletal muscle in CthΔskm mice. The CthΔskm and littermate Cthf/f mice were housed under standard condition until 17 weeks old, and then sacrificed under deep anesthesia. GAS was obtained for quasi-metabolomics analysis, RNA-seq analysis, and Q-PCR. (A), integrated KEGG enrichment analysis of metabolomics and RNA-seq. (B), diagrammatic sketch map of glycolysis/gluconeogenesis, TCA cycle, pentose phosphate pathway, and fatty acid degradation. (C&D), the levels of metabolites in carbohydrate metabolism (C) and fatty acid degradation (D) between CthΔskm and Cthf/f mice (n = 8 in each group). (E–G), the mRNA levels of the enzymes in glycolysis/gluconeogenesis (E), TCA cycle (E), pentose phosphate pathway (F), and fatty acid degradation (G) determined by Q-PCR (n = 6 in each group). The data were expressed as mean ± SEM. *p < 0.05, **p < 0.01. G6PC1, glucose-6-phosphatase catalytic subunit 1; GPI1, glucose-6-phosphate isomerase 1; FBP1, fructose bisphosphatase 1; OGDH, oxoglutarate (alpha-ketoglutarate) dehydrogenase (lipoamide); SUCLA2, succinate-Coenzyme A ligase, ADP-forming, beta subunit; FH1, fumarate hydratase 1; MDH1, malate dehydrogenase 1, NAD (soluble); MDH2, malate dehydrogenase 2, NAD (mitochondrial); EHHADH, enoyl-Coenzyme A, hydratase/3-hydroxyacyl Coenzyme A dehydrogenase; ECHS1, enoyl Coenzyme A hydratase, short chain, 1, mitochondrial; HADHA, hydroxyacyl-CoA dehydrogenase trifunctional multienzyme complex subunit alpha; HADH, hydroxyacyl-Coenzyme A dehydrogenase; HADHB, hydroxyacyl-CoA dehydrogenase trifunctional multienzyme complex subunit beta; ACAA1A, acetyl-Coenzyme A acyltransferase 1A; ACAA1B, acetyl-Coenzyme A acyltransferase 1B; Hk1, hexokinase 1; Hk2, hexokinase 2; Pfkm, phosphofructokinase, muscle; Aldoa, aldolase A, fructose-bisphosphate; Tpi, triosephosphate isomerase 1; Pkm, pyruvate kinase, muscle; Ldha, lactate dehydrogenase A; Pck1, phosphoenolpyruvate carboxykinase 1, cytosolic; Pcx, pyruvate carboxylase; Pdhb, pyruvate dehydrogenase (lipoamide) beta; Dlat, dihydrolipoamide S-acetyltransferase; Cs, citrate synthase; Aco2, aconitase 2, mitochondrial, Idh1, isocitrate dehydrogenase 1 (NADP+), soluble; Idh2, isocitrate dehydrogenase 2 (NADP+), mitochondrial; Sdha, succinate dehydrogenase complex, subunit A, flavoprotein (Fp); Sdhd, succinate dehydrogenase complex, subunit D, integral membrane protein; Rgn, regucalcin; Idnk, idnK gluconokinase homolog (E. coli); Rpia, ribose 5-phosphate isomerase A; Rpe, ribulose-5-phosphate-3-epimerase; Tkt, transketolase; Pgd, phosphogluconate dehydrogenase; Cpt1b, carnitine palmitoyltransferase 1b, muscle; Cpt2, carnitine palmitoyltransferase 2; Acadl, acyl-Coenzyme A dehydrogenase, long-chain; Acadsb, acyl-Coenzyme A dehydrogenase, short/branched chain; Acaa2, acetyl-CoA acyltransferase 2.
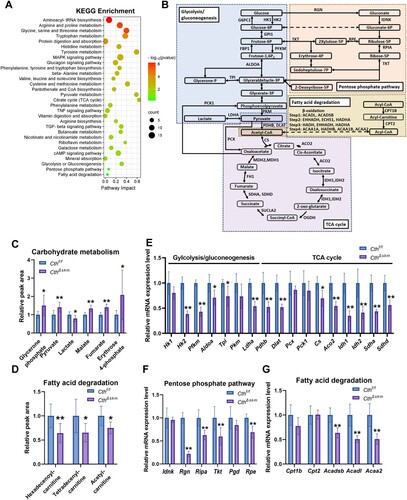
Figure 3. The effects of HFD on body weight, body fat composition, metabolism rate and exercise performance in CthΔskm and Cthf/f mice. The CthΔskm and littermate Cthf/f mice were fed with HFD or chow from 4 weeks old. The body weight and body fat composition were determined from 6 weeks old. Treadmill exhaustive exercise capacity and grip strength were determined at 17 weeks old. The mice were then sacrificed, and fat tissue and skeletal muscle tissues were obtained and weighted. (A–C), the body weight (A), fat body mass (B), and lean body mass (C) in CthΔskm and Cthf/f mice with chow and HFD. (D–F), the white fat mass (D), brown fat mass (E) and skeletal muscle mass (F) in CthΔskm and Cthf/f mice with chow and HFD at 17 weeks old. (G&H), the metabolism rate of CthΔskm and Cthf/f mice with chow and HFD at 16 weeks old. (I–L), grip strength (I) and treadmill exhaustive exercise capacity including running time (J), speed (K) and distance (L). The data were expressed as mean ± SEM. n = 8 in each group. *p < 0.05, **p < 0.01 (Cthf/f vs. Cthf/f+HFD); # p < 0.05, ## p < 0.01 (CthΔskm vs. CthΔskm+HFD); $ p < 0.05, $$ p < 0.01 (Cthf/f+HFD vs. CthΔskm+HFD); & p < 0.05, && p < 0.01 (Cthf/f vs. CthΔskm+HFD). TRI, triceps; QUA, quadriceps; GAS, gastrocnemius; TA, tibialis anterior; RER, respiratory exchange ratio.
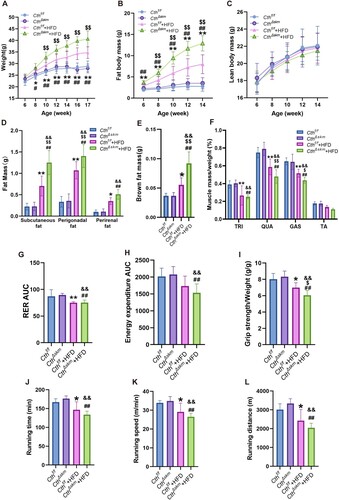
Figure 4. The effects of HFD on fasting blood glucose, insulin sensitivity, and morphology of skeletal muscle in CthΔskm and Cthf/f mice. The CthΔskm and littermate Cthf/f mice were fed with HFD or chow from 4 weeks old. The fasting blood glucose level was determined at 16 weeks old. Intraperitoneal glucose tolerance test (IGTT) and insulin tolerance test (ITT) were determined at 16 weeks old and 17 weeks old, respectively. The mice were then sacrificed, and blood, fat tissue and skeletal muscle tissues were obtained at 17 weeks old. (A–G), fasting blood glucose level (A), IGTT (B&C), ITT (D&E), plasma insulin (F), and HOMA-IR (G) in CthΔskm and Cthf/f mice with chow and HFD (n = 8 in each group). (H), HE staining of GAS muscle and fat tissue cross-section area (n = 6 in each group). Black arrow head, fat tissue. (I), TEM images of the skeletal muscle. Red arrow head, mitochondria. The data were expressed as mean ± SEM. * p < 0.05, ** p < 0.01 (Cthf/f vs. Cthf/f+HFD); # p < 0.05, ## p < 0.01 (CthΔskm vs. CthΔskm+HFD); $ p < 0.05, $$ p < 0.01 (Cthf/f+HFD vs. CthΔskm+HFD); & p < 0.05, && p < 0.01 (Cthf/f vs. CthΔskm+HFD).
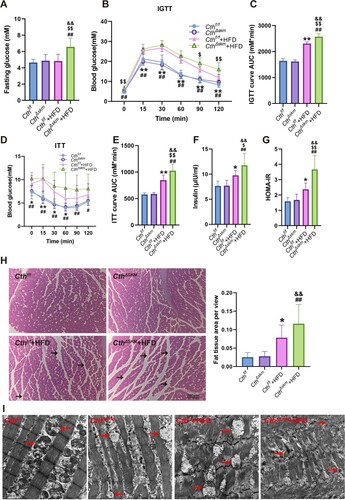
Figure 5. The effects of HFD on energy metabolism in Cthf/f mice based on metabolomics and RNA-seq analysis. The Cthf/f mice were fed with HFD or chow from 4 weeks old. The mice were then sacrificed, and blood, fat tissue and skeletal muscle tissues were obtained at 17 weeks old. GAS was obtained for quasi-metabolomics analysis and RNA-seq analysis. (A), integrated KEGG enrichment analysis of metabolomics and transcriptome in skeletal muscle in the mice upon HFD. (B), levels of the metabolites of carbohydrate metabolism in skeletal muscle (n = 8 each group). (C), levels of the metabolites of fatty acid degradation in skeletal muscle (n = 8 each group). (D&E), mRNA levels of the genes in glycolysis/gluconeogenesis, TCA, and pentose phosphate pathway (D) as well as fatty acid degradation (E) determined by Q-PCR (n = 6 each group). (F), Venn diagram of differential metabolites in Cthf/f+HFD/Cthf/f and CthΔskm/Cthf/f. (G), Venn diagram of KEGG pathways based on analysis of metabolomics between Cthf/f+HFD/ Cthf/f and CthΔskm/Cthf/f. The data were expressed as mean ± SEM. * p < 0.05, ** p < 0.01.
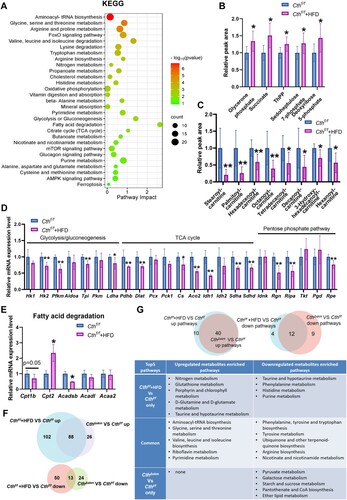
Figure 6. The effects of HFD on energy metabolism in CthΔskm mice based on metabolomics and RNA-seq analysis. CthΔskm and Cthf/f mice were fed with HFD or chow from 4 weeks old. The mice were then sacrificed, and blood, fat tissue and skeletal muscle tissues were obtained at 17 weeks old. GAS was obtained for quasi-metabolomics analysis and RNA-seq analysis. (A), integrated KEGG enrichment analysis of metabolomics and transcriptome in skeletal muscle in CthΔskm mice upon HFD. (B&C), levels of the metabolites of carbohydrate metabolism (B) and fatty acid degradation (C) in skeletal muscle in CthΔskm mice with chow and HFD diet (n = 8 in each group). (D&E), mRNA levels of the genes in glycolysis/gluconeogenesis and TCA (D, only significantly changed genes were shown) as well as fatty acid degradation (E) determined by Q-PCR (n = 6 in each group). (F), Venn diagram of differential metabolites between CthΔskm+HFD/CthΔskm and Cthf/f+HFD/Cthf/f. (G), Venn diagram of KEGG pathways based on analysis of metabolomics between CthΔskm+HFD/CthΔskm and Cthf/f+HFD/Cthf/f. The data were expressed as mean ± SEM. * p < 0.05; ** p < 0.01.
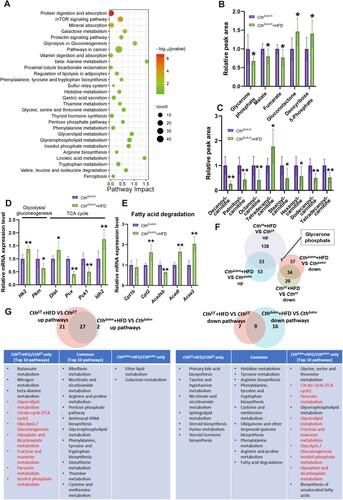
Figure 7. The effects of HFD on AMPK activation, GLUT4 expression, and CD36 expression in CthΔskm and Cthf/f mice. The CthΔskm and littermate Cthf/f mice were fed with HFD or chow from 4 weeks old. The mice were then sacrificed, and blood, fat tissue and skeletal muscle tissues were obtained at 17 weeks old. GAS was obtained for western blotting, immunofluorescence, and immunohistochemistry. (A), the level of AICAR in skeletal muscle (n = 8 in each group). (B), AMPK signaling pathway enriched in GSEA analysis based on RNA-seq data of CthΔskm+HFD and CthΔskm. (C), the protein levels of p-AMPK and AMPK in CthΔskm and Cthf/f mice with HFD and chow determined by western blotting (n = 6 in each group). (D&E), GLUT4 expression and distribution in skeletal muscle determined by immunofluorescence analysis (n = 6 in each group). (F&G), CD36 expression and distribution in skeletal muscle determined by immunohistochemistry (n = 6 in each group). The data were expressed as mean ± SEM. *p < 0.05, ** p < 0.01 (Cthf/f vs. Cthf/f+HFD); # p < 0.05, ## p < 0.01 (CthΔskm vs. CthΔskm+HFD); $ p < 0.05, $$ p < 0.01 (Cthf/f+HFD vs. CthΔskm+HFD); & p < 0.05, && p < 0.01 (Cthf/f vs. CthΔskm+HFD); @ p < 0.05, @@ p < 0.01 (Cthf/f vs. CthΔskm).
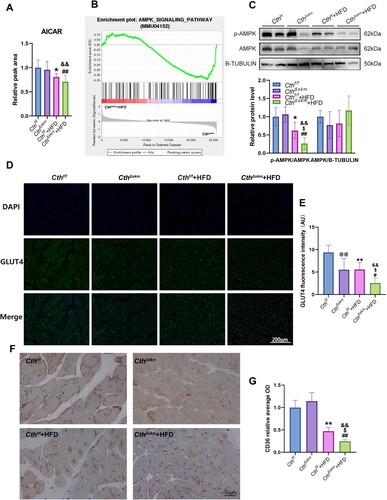
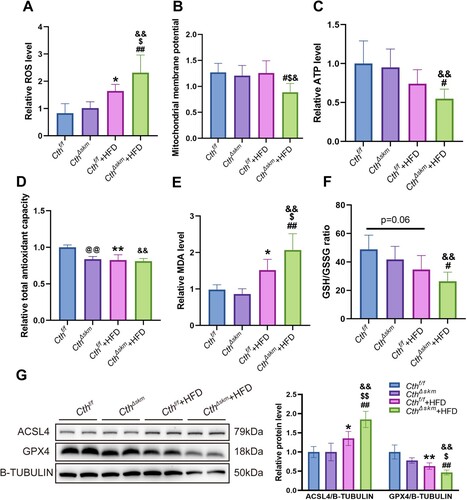
Figure 8. The effects of HFD on mitochondrial function, oxidative stress, and ferroptosis in CthΔskm and Cthf/f mice. The CthΔskm and littermate Cthf/f mice were fed with HFD or chow from 4 weeks old. The mice were then sacrificed, and blood, fat tissue and skeletal muscle tissues were obtained at 17 weeks old. GAS was obtained for mitochondrial function analysis, oxidative stress and western blotting. (A–C), mitochondrial function analysis including reactive oxygen species (ROS, A), mitochondrial membrane potential (MMP, B), and ATP (C) levels. (D–F), oxidative stress index including total antioxidant capacity (T-AOC, D), malondialdehyde (MDA, E), and GSH/GSSG ratio (F). (G), the protein levels of ACSL4 and GPX4 in CthΔskm and Cthf/f mice with HFD and chow determined by western blotting. The data were expressed as mean ± SEM. n = 6 in each group. *p < 0.05, ** p < 0.01 (Cthf/f vs. Cthf/f+HFD); # p < 0.05, ## p < 0.01 (CthΔskm vs. CthΔskm+HFD); $ p < 0.05, $$ p < 0.01 (Cthf/f+HFD vs. CthΔskm+HFD); & p < 0.05, && p < 0.01 (Cthf/f vs. CthΔskm+HFD); @ p < 0.05, @@ p < 0.01 (Cthf/f vs. CthΔskm).
supplemental material_rev.pdf
Download ()supplemental_material_rev cleaned.docx
Download MS Word (8.6 MB)Data availability statement
The RNA-seq data is available at Gene Expression Omnibus (accession number: GSE254704).