
Figures & data
Figure 1. Method of classifying quality attributes in the Kano model. Source: adapted from Witell and Löfgren (Citation2007) and Madzík and Pelantová (Citation2018).
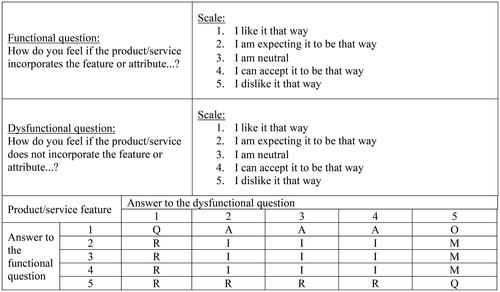
Figure 2. The Kano diagram.
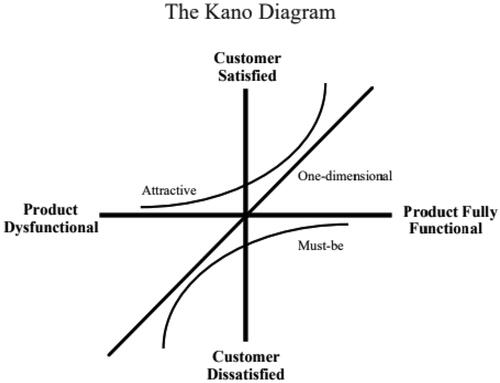
Table 1. Examples of functional and dysfunctional items by dimension
Table 2. Calculation of satisfaction and dissatisfaction levels using the Kano model
Table 3. Demographic data
Table 4. Results for the teaching dimension
Table 5. Results for the administrative services dimension
Table 6. Results for the academic facilities dimension
Table 7. Results for the continuous improvement dimension
Figure 3. Classification of attributes of the teaching dimension.
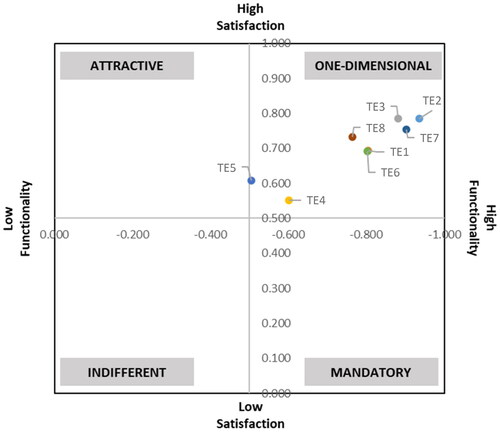
Figure 4. Classification of attributes of the administrative services dimension.
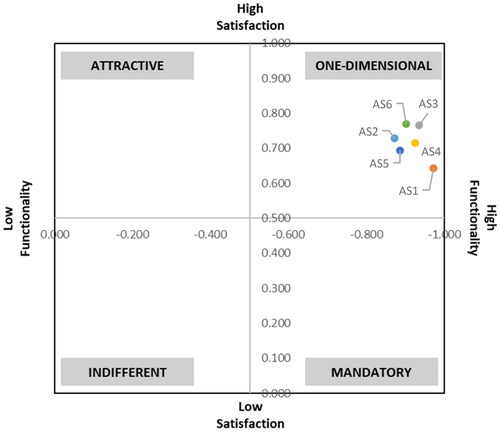
Figure 5. Classification of attributes of the academic facilities dimension.
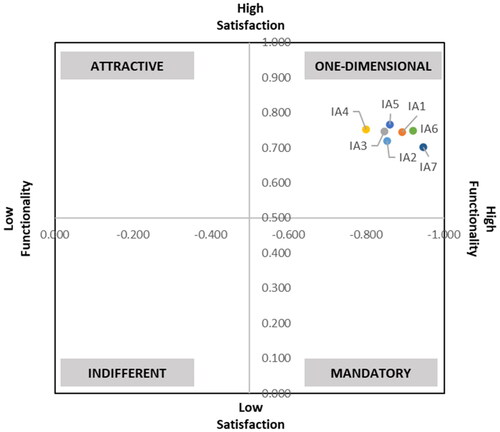
Figure 6. Classification of attributes of the continuous improvement dimension.
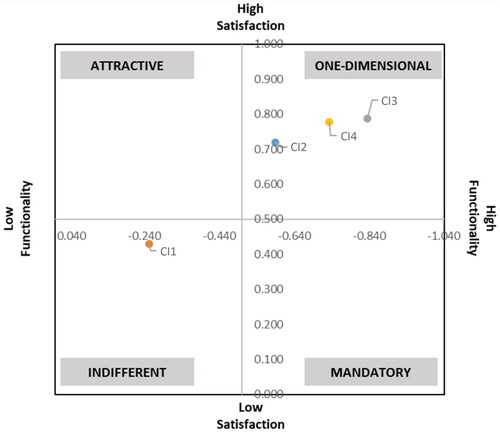
Figure 7. Classification of attributes of the leadership dimension.
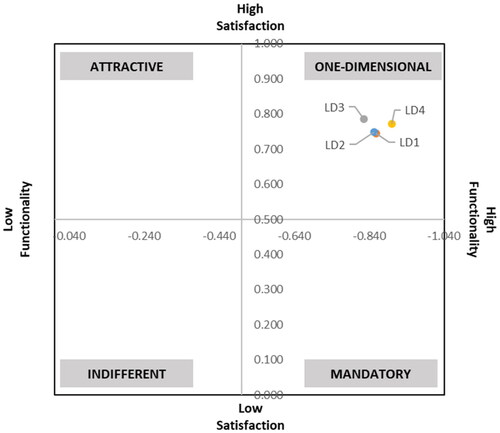
Figure 8. Classification of attributes of the internationalisation dimension.
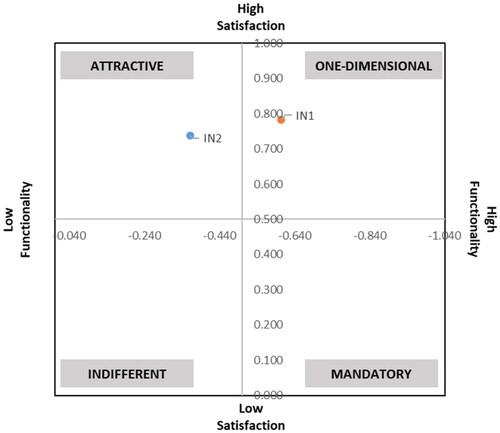
Table 8. Results for the leadership dimension
Table 9. Results for the internationalisation dimension