Figures & data
Figure 1. Annual urban population growth in Angola, Sub-Saharan Africa, and the world. Author’s illustration. Data source: World Bank Development Indicators.
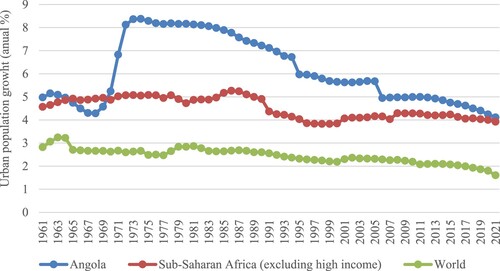
Figure 2. Angolan urban primacy 1930–2022. Author’s illustration. Data source: United Nations (Citation2019) and Amaral (Citation1978).
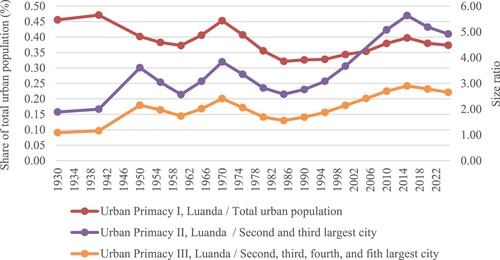
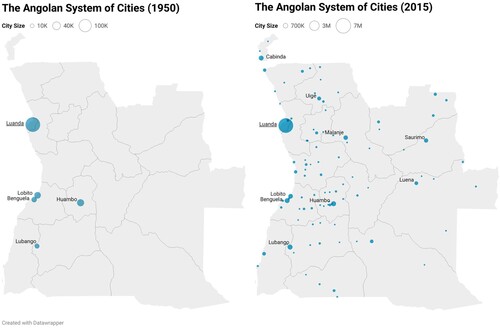
Figure 3. The Angolan system of cities in 1950 and 2015. Cities with more than 10,000 inhabitants. Dot size corresponds to the relative population size that year. Author’s illustration, created with Datawrapper. Data source: OECD Africapolis Project.