Figures & data
Figure 2 Effect of paeonol on immobility time in the tail suspension test in mice. In paeonol groups, the mice were treated with distilled water or paeonol (p.o.) once a day for 7 days. The test was performed 1 h after the last administration of paeonol. In the positive control, fluoxetine (FLU) was given only once (i.p.) 1 h prior to the test. Data are expressed as means ± SEM. **p < 0.01, ***p < 0.001 versus control.
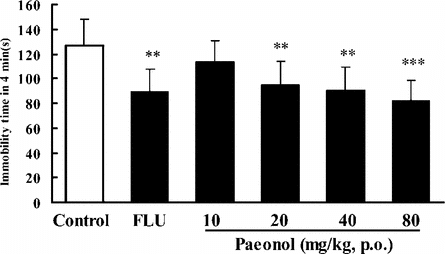
Figure 3 Effects of paeonol on immobility time in the forced swimming test in mice. In paeonol groups, mice were treated with distilled water or paeonol (p.o.) once a day for 7 days. The tests were performed 1 h after the last administration of paeonol. In the positive control, fluoxetine (FLU) was given only once (i.p.) 1 h prior to the test. Data are expressed as means ± SEM. **p < 0.01, ***p < 0.001 versus corresponding control.
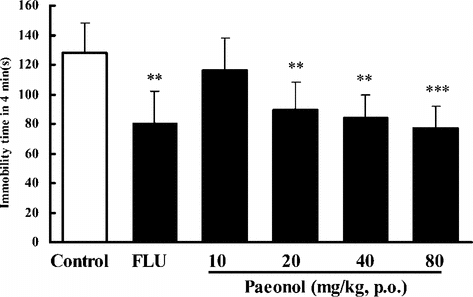
Figure 4 Effects of paeonol on immobility time in the forced swimming test in rats. In paeonol groups, the rats were treated with paeonol (p.o.) prior to the tests. In the positive control, fluoxetine (FLU) was given only once (i.p.) 1 h before the tests. Data are expressed as means ± SEM. *p < 0.05, **p < 0.01 versus corresponding control.
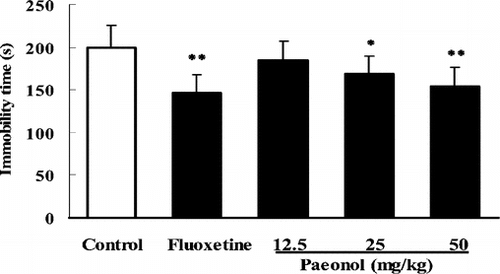
Table 1 Effects of 7-day treatments with paeonol and FLU on the open field parameters recorded for 5 min in mice.
Figure 5 Protective effect of paeonol on the PC12 cells from the lesion induced by corticosterone. Cells were exposed to corticosterone 10 µM in the absence or presence of paeonol or fluoxetine for 48 h; cell viability was measured using a colorimetric MTT assay (A) and LDH assay (B). Data are expressed as means ± SEM. ###p < 0.001 versus corresponding control. **p < 0.01 and ***p < 0.001 versus corresponding corticosterone-treated groups.
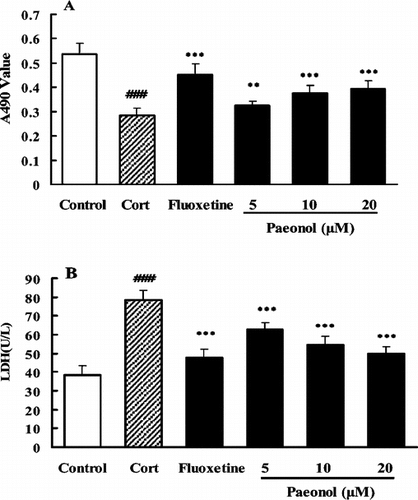
Figure 6 Effect of paeonol or fluoxetine on the corticosterone-induced [Ca2+]i overloading in PC12 cells. Cells were exposed to corticosterone 200 µM in the absence or presence of paeonol or fluoxetine for 48 h, and [Ca2+]i was detected using the sensitive indicator dye, Fura-2/AM. Data are expressed as means ± SEM. ###p < 0.001 versus control. **p < 0.01, ***p < 0.001 versus corticosterone-treated group.
![Figure 6 Effect of paeonol or fluoxetine on the corticosterone-induced [Ca2+]i overloading in PC12 cells. Cells were exposed to corticosterone 200 µM in the absence or presence of paeonol or fluoxetine for 48 h, and [Ca2+]i was detected using the sensitive indicator dye, Fura-2/AM. Data are expressed as means ± SEM. ###p < 0.001 versus control. **p < 0.01, ***p < 0.001 versus corticosterone-treated group.](/cms/asset/38769c31-45ff-44f8-8ffa-36cbb6251d4c/iphb_a_168527_f0006_b.gif)
