
Figures & data
Table 1. Diagrammatic representation of groups.
Figure 1. SXSH protects cardiac function after AMI. (A) The schematic diagram for SXSH administration in rats after AMI. (B) Representative parasternal long-axis views and M-mode images. (C) Representative color Doppler imaging of the cardiac outflow tract and blood flow velocity. (D-F) The quantization charts corresponding to EF, FS, and AV. (G) Representative heart pictures of H&E staining (scale bar equals 100 µm). serum activities of (H) LDH, and (I) CK-MB. #p < 0.05, ##p < 0.01 vs. Sham and *p < 0.05, **p < 0.01 vs. Model.
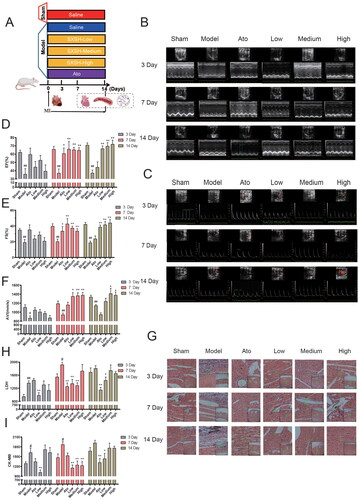
Figure 2. SXSH modulates gut microbiota post AMI. (A) Alpha diversity of Shannon index in each group. (B) Beta diversity of Bray Curtis-based PCoA of medium dose SXSH groups for 3 days, 7 days, and 14 days administration. (C) Statistical analysis of representative OTUs among different groups after 14 days administration.
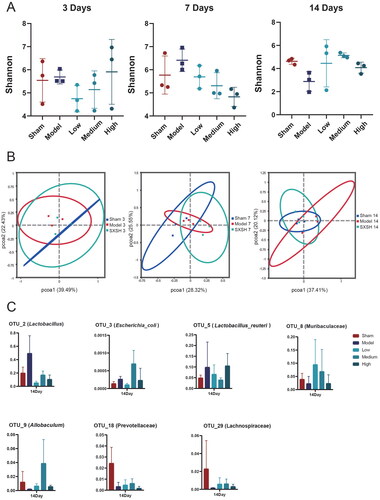
Table 2. Changes in gut microbiota on different days.
Figure 3. Antibiotics induced dysbacteriosis interferes cardiac protective effect of SXSH. (A) The schematic diagram for SXSH and ABX administration in AMI rats. (B) Representative parasternal long-axis views and M-mode images, and color Doppler imaging of the cardiac outflow tract and blood flow velocity. (C-E) The quantization charts corresponding to EF, FS, and AV. (F) Representative heart pictures of H&E staining [scale bar equals 3000 µm (top), 650 µm and 75 µm (bottom)]. serum activities of (G) SOD, (H) MDA, (I) LDH, and (J) CK-MB. #p < 0.05, ##p < 0.01, ###p < 0.001 vs. Sham, **p < 0.01, ***p < 0.001 vs. Model, and ^^p < 0.01, ^^^p < 0.001 vs. SXSH.
![Figure 3. Antibiotics induced dysbacteriosis interferes cardiac protective effect of SXSH. (A) The schematic diagram for SXSH and ABX administration in AMI rats. (B) Representative parasternal long-axis views and M-mode images, and color Doppler imaging of the cardiac outflow tract and blood flow velocity. (C-E) The quantization charts corresponding to EF, FS, and AV. (F) Representative heart pictures of H&E staining [scale bar equals 3000 µm (top), 650 µm and 75 µm (bottom)]. serum activities of (G) SOD, (H) MDA, (I) LDH, and (J) CK-MB. #p < 0.05, ##p < 0.01, ###p < 0.001 vs. Sham, **p < 0.01, ***p < 0.001 vs. Model, and ^^p < 0.01, ^^^p < 0.001 vs. SXSH.](/cms/asset/5787fc7a-16b5-49c1-9f61-61241ad0b3bc/iphb_a_2289577_f0003_c.jpg)
Figure 4. Circulating metabolomics for the quantification of metabolites among different groups. (A) The PCA score plots between Sham and Model in positive ion mode [R2Xp1 = 0.336, R2Xp2 = 0.224] and negative ion mode [R2Xp1 = 0.327, R2Xp2 = 0.267]. (B) The OPLS-DA score plots between Sham and Model in positive ion mode [R2X = 0.422, R2Y = 0.973, Q2 = 0.859] and negative ion mode [R2X = 0.346, R2Y = 0.912, Q2 = 0.695]. (C) Volcano plot showing the differentially accumulated and significantly changed metabolites in Model group compared to Sham. (D) The PCA score plots between Sham, Model, and SXSH in positive ion mode [R2Xp1 = 0.21, R2Xp2 = 0.149, R2Xp3 = 0.116, R2Xp4 = 0.112] and negative ion mode [R2Xp1 = 0.229, R2Xp2 = 0.182, R2Xp3 = 0.119]. (E) Pathway enrichment based on altered metabolites.
![Figure 4. Circulating metabolomics for the quantification of metabolites among different groups. (A) The PCA score plots between Sham and Model in positive ion mode [R2Xp1 = 0.336, R2Xp2 = 0.224] and negative ion mode [R2Xp1 = 0.327, R2Xp2 = 0.267]. (B) The OPLS-DA score plots between Sham and Model in positive ion mode [R2X = 0.422, R2Y = 0.973, Q2 = 0.859] and negative ion mode [R2X = 0.346, R2Y = 0.912, Q2 = 0.695]. (C) Volcano plot showing the differentially accumulated and significantly changed metabolites in Model group compared to Sham. (D) The PCA score plots between Sham, Model, and SXSH in positive ion mode [R2Xp1 = 0.21, R2Xp2 = 0.149, R2Xp3 = 0.116, R2Xp4 = 0.112] and negative ion mode [R2Xp1 = 0.229, R2Xp2 = 0.182, R2Xp3 = 0.119]. (E) Pathway enrichment based on altered metabolites.](/cms/asset/57a62428-54ea-4e38-b1dc-74371a4ad9c0/iphb_a_2289577_f0004_c.jpg)
Table 3. SXSH administration regulates differential metabolites
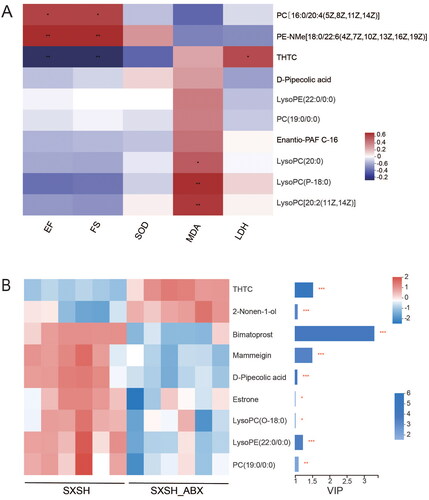
Figure 5. Biomarker analysis and heatmap of identified marker metabolites. (A) Spearman correlation analysis among key efficacy indicators and marker metabolites. (B) Heatmap of selected marker metabolites among SXSH and SXSH-ABX group based on VIP > 1.
Data availability statement
The data generated for 16S rRNA gene profiling of bacteria are available in the NCBI repository with project accession number PRJNA900688.