
Figures & data
Figure 1. BBR pretreatment lowered serum TNF-α, IL-1β and S100B levels in burned mice. Mice were assigned into sham, burns, burns plus BBR (25 mg/kg/d, 3 d), or burns plus BBR (50 mg/kg/d, 3 d) group. At indicated timepoints (2, 6, 12, 24, 36, 48 h postburn) 4 mice were euthanized. Blood samples were centrifuged and serum TNF-α (A), IL-1β (B) and S100B (C) levels were assayed by ELISA. Data were expressed as mean ± SD. *p < 0.05, **p < 0.01 vs. Sham; #p < 0.05, ##p < 0.01 vs. Burns.
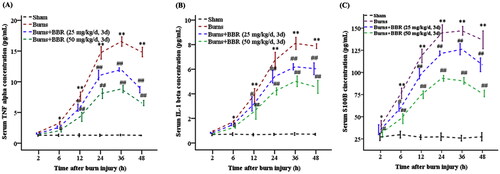
Figure 2. BBR pretreatment reduced S100B generation in colonic mucosa in burned mice. Mice were assigned into sham, burns, burns plus BBR (25 mg/kg/d, 3 d), or burns plus BBR (50 mg/kg/d, 3 d) groups. At every postburn timepoint 4 mice were euthanized. Gut mucosal tissues were scrapped and S100B content in mucosa was determined by ELISA. Data were expressed as mean ± SD. *p < 0.05, **p < 0.01 vs. Sham; #p < 0.05, ##p < 0.01 vs. Burns.
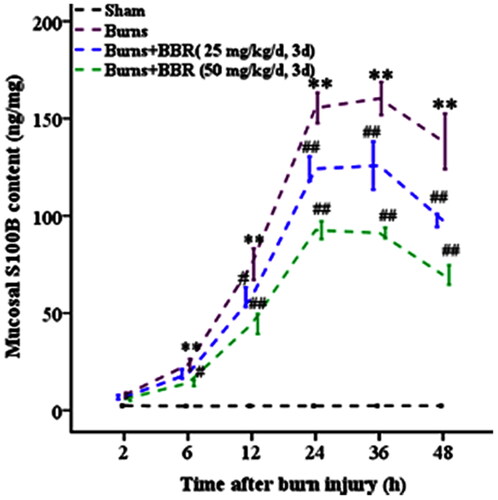
Figure 3. BBR and S100BmAb treatment reduced GVB permeability in burned mice. FITC-dextran 70 kDa was injected into colonic loops of mice treated with sham, burns, burns plus BBR (25 or 50 mg/kg/d, 3 d) (A), or buns plus S100BmAb (5, 10 or 15 μg/kg) (B). Serum FITC-dextran 70 kDa was measured at 48 h postburn. Data were expressed as mean ± SD. **p < 0.01 vs. Sham; ##p < 0.01 vs. Burns; &&p < 0.01 vs. Burns plus BBR (25 mg/kg/d, 3 d) or Burns plus S100BmAb (5 μg/kg); $$p < 0.01 vs. Burns plus S100BmAb (10 μg/kg).
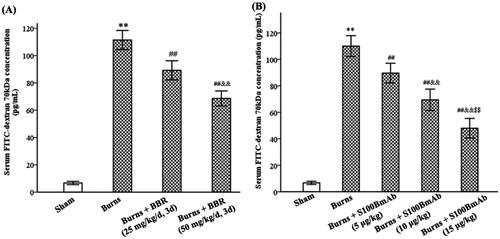
Figure 4. S100B enema increased while berberine pretreatment reduced GVB permeability. Control mice were treated with saline enema, S100B enema (1 or 5 μM), or S100B enema plus BBR (25 or 50 mg/kg/d, 3 d) (A). Burned mice were treated with S100B enema (1 μM), BBR (25 or 50 mg/kg/d, 3 d), or S100B enema plus BBR (B). Serum FITC-dextran 70 kDa was assayed 12 h after S100B enema. Data were expressed as mean ± SD. **p < 0.01 vs. saline or sham; ##p < 0.01 vs. S100B (5 μM) or Burns; &&p < 0.01 vs. S100B (5 μM) plus BBR (25 mg/kg/d, 3 d) or Burns plus BBR (25 mg/kg/d, 3 d); δδp < 0.01 vs. Burns plus S100B (1 μM).
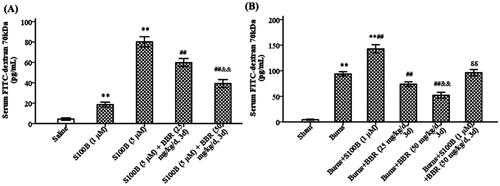
Figure 5. S100B enema increased while BBR pretreatment decreased PV-1 expression in mice. Control mice were treated with saline enema, S100B enema (5 μM), or S100B enema plus BBR (25 or 50 mg/kg/d, 3 d). PV-1 expression was assayed by western blot. Representative gels for PV-1 (A). The relative density of PV-1 was calculated relative to that of β-actin (B). Results shown are means ± SD. **p < 0.01 vs. Control; ##p < 0.01 vs. S100B (5 μM).
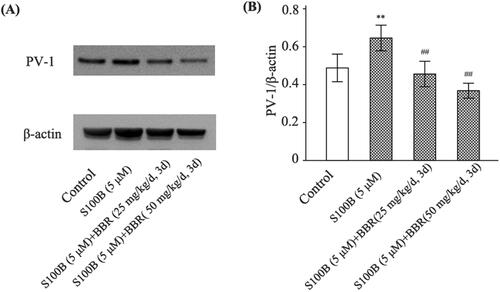
Figure 6. S100B and Z-IETD-FMK increased while BBR decreased MIMECs permeability. MIMECs were treated with saline (Control), S100B (1 or 5 μM), S100B plus Z-IETD-FMK (5 μM), or S100B plus BBR (1 or 5 μM). FITC-dextran 70 kDa was used to assess the endothelial permeability. The experiments were performed in triplicate. Data were expressed as means ± SEM. **p < 0.01 vs. Control; #p < 0.05, ##p < 0.01 vs. S100B (5 μM).
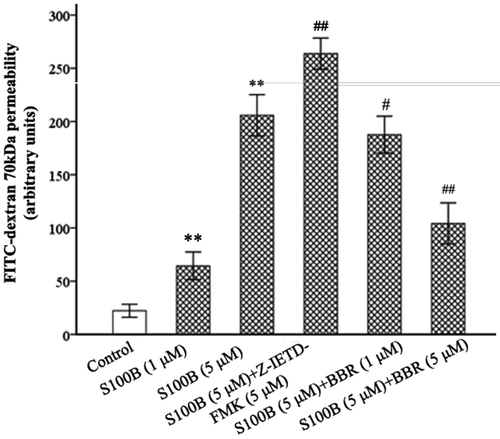
Figure 7. S100B reduced while BBR increased occludin and caspase-8 expression in MIMECs. MIMECs were treated with saline (Control), S100B (5 μM), or S100B plus BBR (1 or 5 μM). Occludin and caspase-8 was assayed by Western blot. Representative gels were shown in the left panel (A) and statistical results in the right panel (B). The experiments were performed in triplicate. Data were expressed as means ± SEM. **p < 0.01 vs. Control; #p < 0.05, ##p < 0.01 vs. S100B (5 μM).
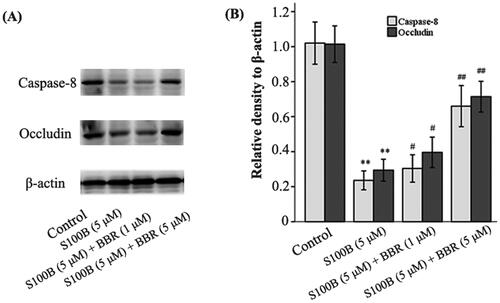
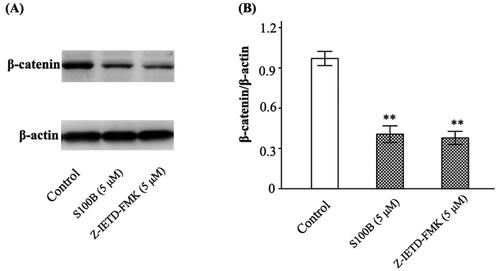
Figure 8. S100B and Z-IETD-FMK decreased β-catenin expression in MIMECs. MIMECs were treated with saline (Control), S100B (5 μM), or Z-IETD-FMK (5 μM). β-catenin was determined by Western blot. Representative gels were shown in the left panel (A) and the statistical results in the right panel (B). The experiments were performed in triplicate. Data were expressed as means ± SEM. **p < 0.01 vs. Control.
Data availability statement
The data used to support the findings of this study are available from the corresponding author upon request.