Figures & data
Table 1. Primer sequences for RT-PCR.
Figure 1. Effect of NMN on cell proliferation and apoptosis of LPS-stimulated MH-S lines. (A) Cell viability of differentially treated MH-S cells was determined by CCK8 kit. (B–C) Apoptosis of MH-S cells induced by different groups as indicated was measured by Annexin V-FITC/PI. Data are portrayed as mean ± SD and statistical analysis was performed by one-way ANOVA followed by the Bonferroni post hoc test. *p < 0.05, **p < 0.01 vs. controls, #p < 0.05, ##p < 0.01 vs. LPS group.
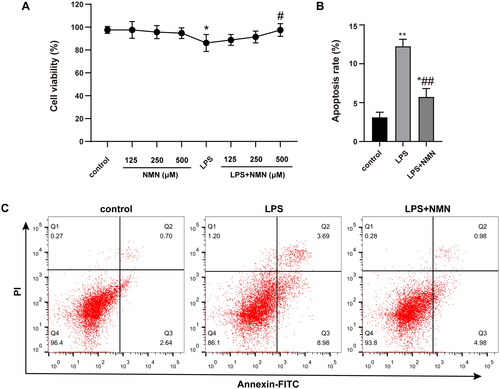
Figure 2. NMN promotes M2-type macrophage polarization in LPS-stimulated MH-S cells. (A) Relative mRNA expressions of IL-1β, TNF-α, IL-6 and IL-10 were detected. (B) Representative mRNA levels of iNOS. (C) Representative mRNA levels of Arg1. (D–F) Representative blots and relative expressions of iNOS and Arg1 in MH-S cells. Data are presented as mean ± SD and analysed by one-way ANOVA corrected with Bonferroni test. *p < 0.05 and **p < 0.01 relative to controls, #p < 0.05 and ##p < 0.01 relative to LPS group, respectively.
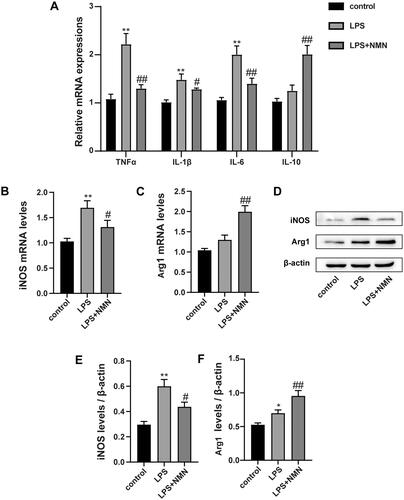
Figure 3. NMN attenuates lung injury induced by LPS. (A) The image of histopathologic changes of lung sections with H&E staining (×400). (B) Semiquantitative assessment of ALI using lung injury scores. The grading scale of 0 = minimal damage, 1+ =mild damage (25%), 2+ =moderate damage (50%), 3+ =severe damage (75%), and 4+ =maximal damage (almost 100%). (C) The W/D ratio. (D) MPO activity. Data are presented as mean ± SD and analysed by one-way ANOVA followed with Bonferroni test. *p < 0.05, **p < 0.01 vs. control and #p < 0.05, ##p < 0.01 vs. LPS group.
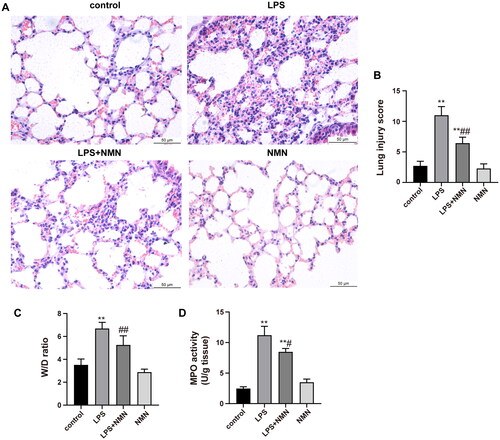
Figure 4. The impact of NMN on NAD+ and ATP levels in lung tissues. (A) The levels of NAD+ were determined with an NAD/NADH Assay Kit. (B) NAD+/NADH ratio in lung tissues. (C) ATP content was also detected in this part of the study. Data are expressed as mean ± SD using one-way ANOVA followed with Bonferroni test. *p < 0.05, **p < 0.01 vs. control and #p < 0.05, ##p < 0.01 vs. LPS group.
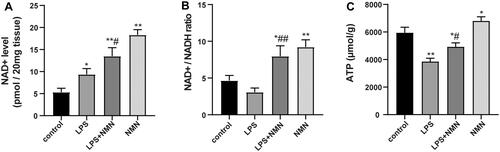
Figure 5. Effect of NMN on macrophage differentiation during LPS-induced ALI. (A) Relative mRNA levels of inflammatory cytokines IL-1β, TNF-α, IL-6, and IL-10 were determined. (B–D) Western blots of iNOS and Arg1 and quantitation. (E–G) The levels of CD86 (for M1 macrophages) and CD206 (for M2 macrophages) were evaluated by flow cytometric analysis. Values are expressed as mean ± SD and analysed by one-way ANOVA corrected with Bonferroni coefficient. *p < 0.05, **p < 0.01 vs. control group and #p < 0.05, ##p < 0.01 vs. LPS group, respectively.
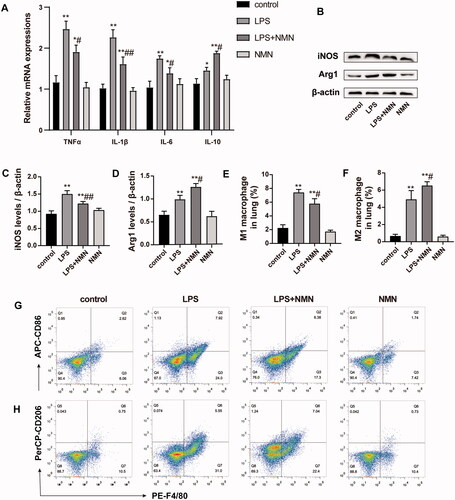
Figure 6. NMN activated the SIRT1/NF-κB pathway in sepsis-related ALI. (A–E) Representative bands and quantification of SIRT1, acetylated, phosphorylated NF-κB-p65, and NF-κB-p65. (F–G) Levels of acetylated NF-κB-p65 were shown by immunofluorescence (scale bar = 50 μm). Data are presented as means ± SD and analysed by one-way ANOVA followed with Bonferroni coefficient. **p < 0.01 compared with control; #p < 0.05, ##p < 0.01 compared with LPS group.
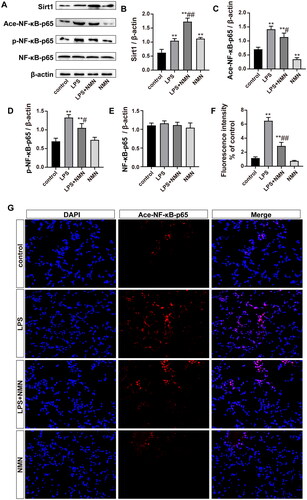
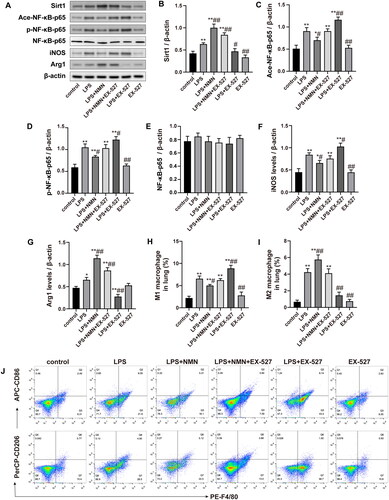
Figure 7. The SIRT1/NF-κB pathway was associated with the NMN-mediated M2 macrophage polarization. (A–G) Representative bands and quantification of SIRT1, acetylated, phosphorylated NF-κB-p65, NF-κB-p65, iNOS, and Arg1. (H–J) The levels of CD86 (for M1 macrophages) and CD206 (for M2 macrophages) were evaluated by flow cytometric analysis. Data are presented as means ± SD and analysed by one-way ANOVA followed with Bonferroni coefficient. *p < 0.05, **p < 0.01 compared with control; #p < 0.05, ##p < 0.01 compared with LPS group.