
Figures & data
Table 1. Primers for quantitative PCR analysis.
Table 2. IC50, RI, and relative delay rate of drug resistance induced resistant cells.
Figure 1. The delayed drug resistance effect of SFI in NSCLC cells. (A, B, C, D) According to the MTT method, the cell proliferation inhibition rate and IC50 of gefitinib (1, 3, 9, 27, 81, 243, 729, 2187 nmol/L) and RI of each induced drug-resistant cells were measured after 48 h of treatment in four stages. Data are expressed as mean ± SEM (n = 3) *p < 0.05, **p < 0.01, ***p < 0.001 and ****p < 0.0001 compared to gefitinib alone inducing gefitinib-resistant PC9-GR cells.
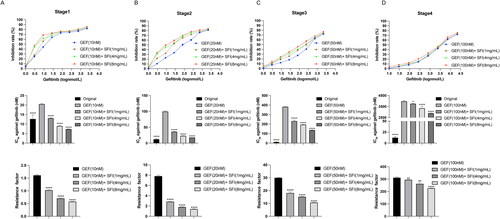
Figure 2. SFI relieves gefitinib resistance by reducing IL-22 levels. (A, B) After treating PC9/GR and H1975 cells with SFI (10 mg/mL) for 6 h, the mRNA levels of various cytokines were evaluated. Compared to the control group, * p < 0.05, ** p < 0.01. (C) IL-22 protein expression of cellular protein extracted from indicated cells was assessed by Western blot. *p < 0.05 or **p < 0.01 compared to PC9 cells. (D) Results of qRT-PCR presented IL-22 mRNA levels in PC9/GR and H1975 cells. *p < 0.05 or **p < 0.01 compared to PC9 cells. (E) IL-22 protein expression was verified by Western blot in SFI (10 mg/mL) treated or untreated indicated cells. (F) Cells were treated or untreated with 2.5, 10, or 40 mg/mL SFI for 6 h, then relative IL-22 mRNA level in indicated cells was measured by qRT-PCR. (G) The mRNA expression levels of IL-22RA1 in PC9/GR and H1975 cells after a 6 h treatment of 10 mg/mL SFI were determined using qRT-PCR. (H) The data on the relationship between IL-22 (221165_s_at) expression and overall survival for lung cancer patients and p-values were obtained from the Kaplan-Meier plotter database (http://kmplot.com/analysis/index.php?p=background). (I) After treating PC9/GR and H1975 cells with or without recombinant IL-22 (50 ng/mL) for 48 h, cell proliferation was assessed by MTT assay. **p < 0.01 compared to the control without exogenous addition of IL-22. (J, K) PC9/GR and H1975 cells were incubated with IL-22 (50 ng/mL) at the indicated time points. The relative migration rate was measured. **p < 0.01, ***p < 0.001 compared to the control without exogenous addition of IL-22 at a 48 h time point.
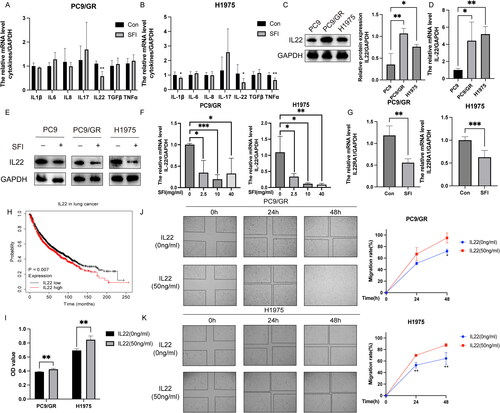
Figure 3. SFI inhibits the STAT3/AKT branch activated by IL-22 treatment in PC9/GR and H1975 cells. (A, B) Western blot of PC9/GR and H1975 cells determining p-STAT3 and p-AKT following stimulation with IL-22 (50 ng/mL) for 10 or 30 min. (C, D) Western blot analysis of PC9/GR and H1975 cells was stimulated with IL-22 (50 ng/mL) for 20 min after pre-treated or not with 10 mg/mL SFI for 24 h or 48 h. Results are expressed as mean ± SEM (n = 3) *p < 0.05, **p < 0.01, ***p < 0.001 when compared with control group; #p < 0.05, ##p < 0.01, ###p < 0.001 when compared with IL-22 group in A, B, C, and D.
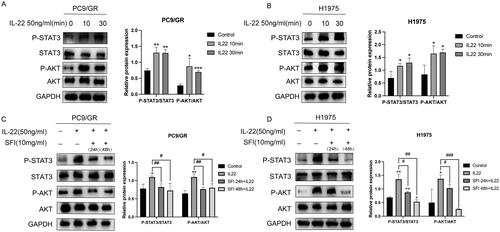
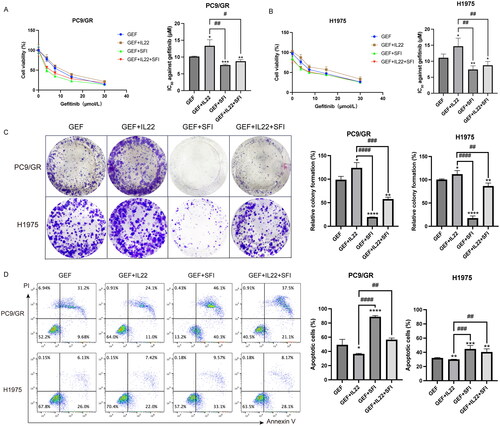
Figure 4. SFI facilitates the gefitinib cytotoxicity of PC9/GR and H1975 cells. (A, B) Cell proliferation inhibition profiles were measured after 48 h of different concentrations of gefitinib (30, 15, 7.5, 3.25 μmol/L), respectively co-administered IL-22 (50 ng/mL) alone or in combination with SFI (10 mg/mL) exposure to PC9/GR and H1975 cells. (C) Clonogenic assays of PC9/GR and H1975 cells after gefitinib alone, gefitinib + IL-22, gefitinib + SFI, and gefitinib + IL-22 + SFI treatment for 13 days. (D) After 48 h incubation with different schemes, including gefitinib alone, gefitinib + IL-22, gefitinib + SFI, and gefitinib + IL-22 + SFI, flow cytometric analysis of apoptosis was detected, and the data were processed by FlowJo VX software. Results are expressed as mean ± SEM (n = 3) *p < 0.05, **p < 0.01, ***p < 0.001, ****p < 0.0001, when compared with gefitinib; ##p < 0.01, ###p < 0.001, ####p < 0.001 when compared with gefitinib + IL-22.
Data availability statement
The data sets used in the current study are available from the corresponding author upon reasonable request.