
Figures & data
Figure 1. Ultraviolet absorption spectra of coixol (A) and CDP (B).
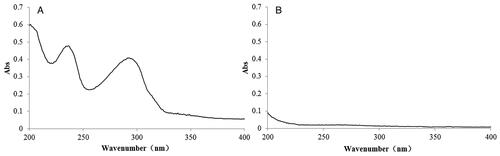
Figure 2. (A) HPLC figures of the coixol-CDP inclusion compound; (B) HPLC figure of the sample of CDP; (C) standard curve of coixol.
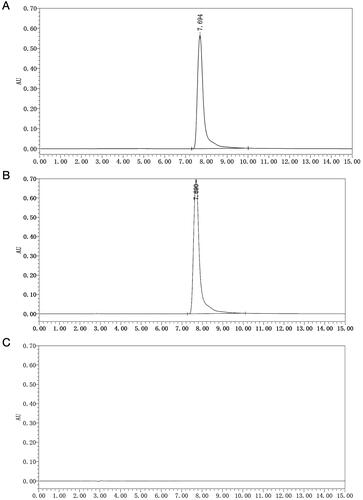
Figure 3. Standard curve of coixol.
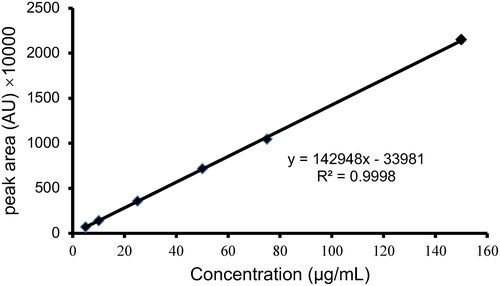
Table 1. The accuracy test of coixol.
Table 2. The stability test of coixol.
Table 3. The average recovery test of coixol.
Table 4. The yield and inclusion rate of coixol-CDP compounds.
Table 5. Data of light stability experiments.
Figure 4. Scanning electron micrographs of different samples. (A) β-CD; (B) CDP; (C) coixol; (D) physical mixture of CDP and coixol; (E) coixol-CDP inclusion compound.
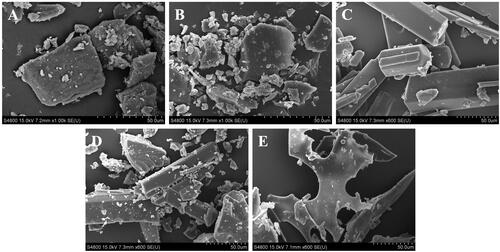
Figure 5. FT-IR figures of different samples. (A) β-CD; (B) CDP; (C) coixol; (D) physical mixture of CDP and coixol; (E) coixol-CDP inclusion compound.
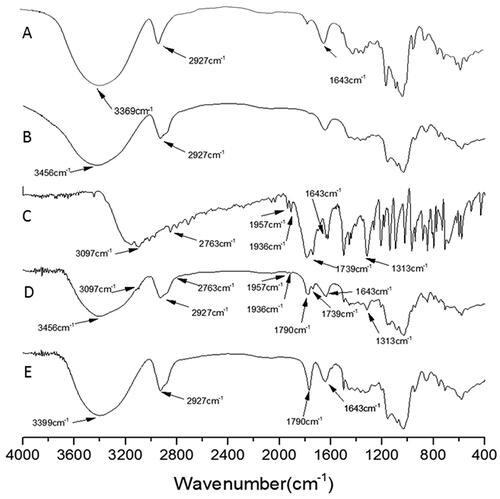
Figure 6. DSC figures of different samples. (A) β-CD; (B) CDP; (C) coixol; (D) physical mixture of CDP and coixol; (E) coixol-CDP inclusion compound.
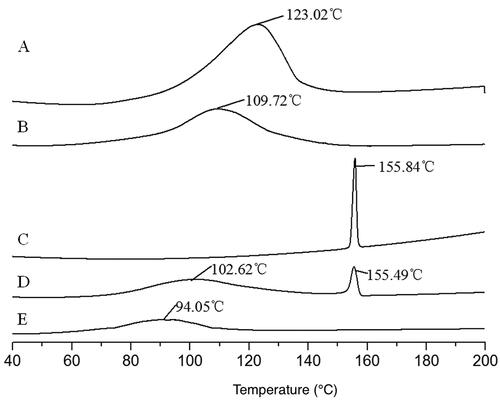
Figure 7. XRD figures of different samples. (A) β-CD; (B) CDP; (C) coixol; (D) physical mixture of CDP and coixol; (E) coixol-CDP inclusion compound.
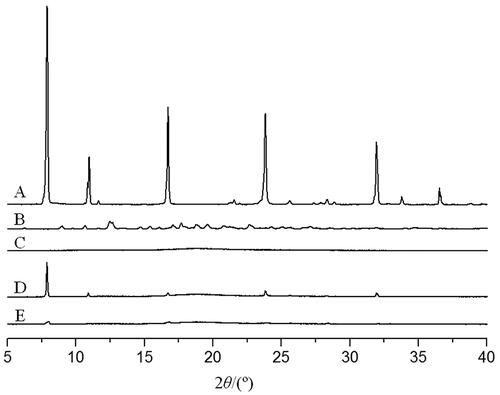
Figure 8. Inhibitory effects of coixol and the coixol-CDP inclusion compound on the A549 cells (x ± s, n = 3). Note: the coixol-CDP inclusion compound compares with coixol (**p < 0.01).
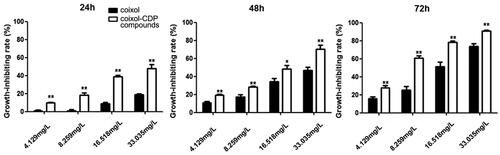
Table 6. The inhibition effects of the coixol-CDP inclusion compound on A549 cells (x ± s, n = 3).
Figure 9. Hoechst33258 Fluorescent staining assay for morphological changes of the A549 cells induced by coixol and the coixol-CDP inclusion compound (×200). (A, B, C, D) the concentrations of coixol are 0, 8.259, 16.518, and 33.035 mg/L in sequence. (A′, B′, C′, D′) the concentrations of coixol-CDP inclusion compound are 0, 8.259, 16.518, and 33.035 mg/L in sequence.
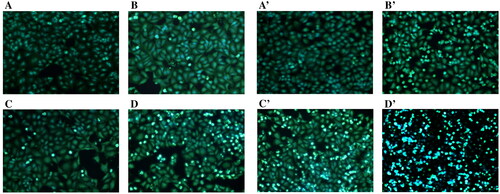
Figure 10. Flow cytometry results. (A, B, C, D) The concentrations of coixol are 0, 8.259, 16.518, and 33.035 mg/L in sequence; (A′, B′, C′, D′) the concentrations of the coixol-CDP inclusion compound are 0, 8.259, 16.518, and 33.035 mg/L in sequence. (E) The apoptotic effects of coixol and the coixol-CDP inclusion compound on the A549 cells (x ± s, n = 3). Note: the coixol-CDP inclusion compound compares with coixol (** p < 0.01).
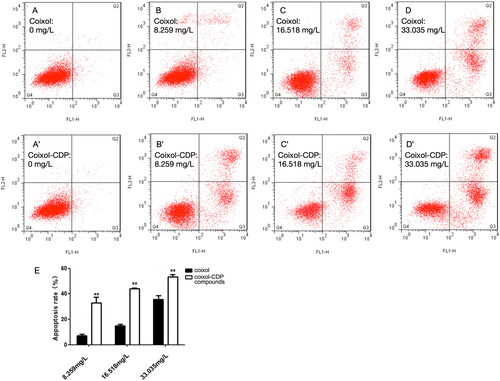
Figure 11. Cell cycle examination on the A549 cells. (A, B, C, D) The concentrations of coixol are 0, 8.259, 16.518, and 33.035 mg/L in sequence; (A′, B′, C′, D′) the concentrations of the coixol-CDP inclusion compound are 0, 8.259, 16.518, and 33.035 mg/L in sequence. (E) The cycle effect of coixol and its compounds on A549 cell (x ± s, n = 3). (*, p < 0.05 vs. corresponding coixol; **, p < 0.01 vs. corresponding coixol).
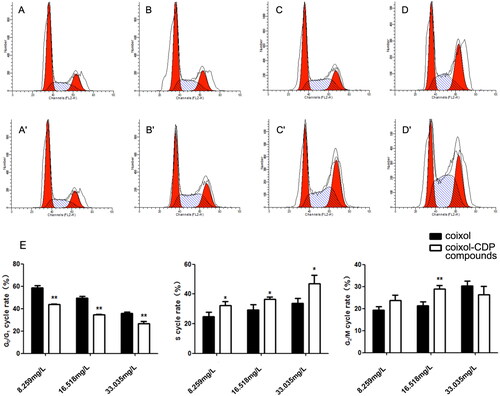
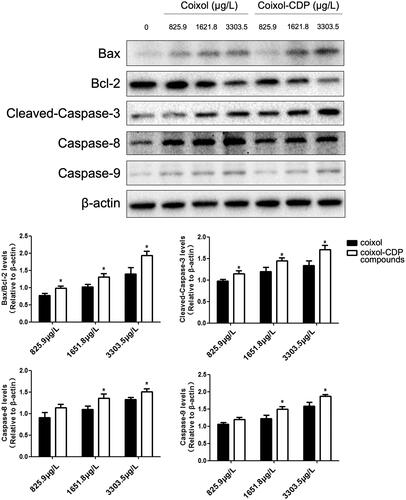
Figure 12. The protein levels of cleaved-Caspase-3, Caspase-8, Caspase-9, Bax, and Bcl-2 detected by Western blots (x ± s, n = 3). (*, p < 0.05 vs. corresponding coixol).
Data availability statement
The datasets used and/or analyzed are available from the corresponding author upon reasonable request.