
Figures & data
Figure 1. HPLC chromatograms of mixed reference solution and TCPT sample solution. (A) HPLC chromatogram of mixed reference solution. (B) HPLC chromatogram of TCPT sample solution. Notes: peak 1, skimmin; peak 2, 8-methoxycoumarin-7-O-β-d-glucose; peak 3, 7-hydroxycoumarin; peak 4, 7-hydroxy-8-methoxycoumarin.
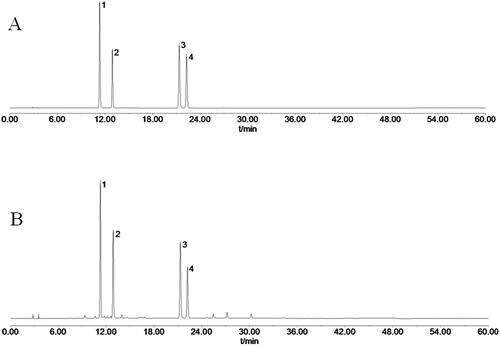
Figure 2. Identification and tracking of exosomes. (A) Morphological characteristics of exosomes were observed under electron microscopy (Bar = 100 nm). (B) The particle size distribution of exosomes was analysed by nanoparticle tracking analysis (NTA). (C) The expression of exosome marker proteins (CD9, TSG101) was detected by Western blot. (D) Dil-labelled exosomes were taken up by HUVECs; Bar = 25 μm.
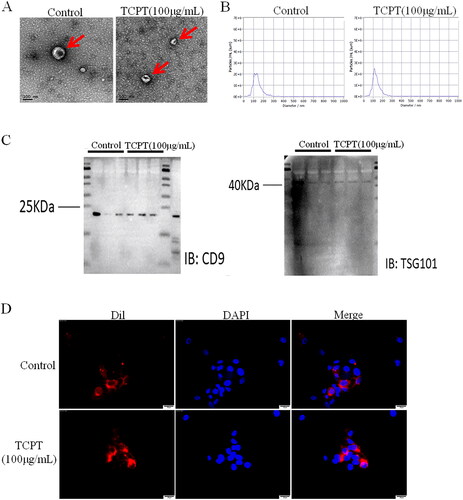
Figure 3. Exo-TCPT inhibits the angiogenic activity of HUVECs. (A) Images of lumen formation in each treatment group, Bar = 250 μm. (B) The length of lumen formation and quantitative data of nodes were analysed by ImageJ (n = 3), **p < 0.01 vs. control. (C) Images of Transwell chamber experiments in each treatment group, Bar = 200 μm. (D) Quantitative data analysis of the OD value of HUVEC migrating cells (n = 3), **p < 0.01 vs. control. (E) The protein levels of FLT-1, VCAM-1, VEGFR-2 and GAPDH were determined by Western blot. (F) The relative density was analysed by protein simple analysis software, **p < 0.01 vs. control.
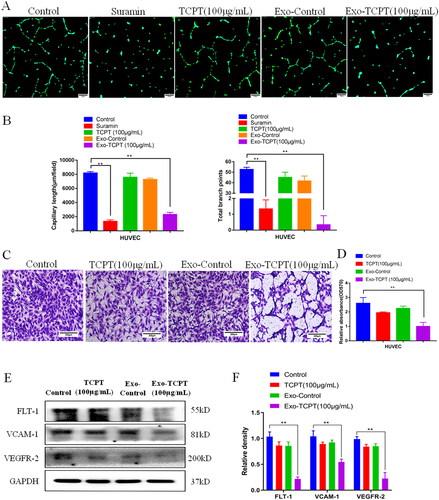
Figure 4. Changes in exosome miRNA expression profiles caused by TCPT. (A) Volcano map of differential miRNAs before and after TCPT treatment. Red, significantly upregulated miRNAs in the exosome; blue, significantly down-regulated miRNAs in the exosome; grey, no significant difference. (B) Cluster analysis of differential miRNAs. Compared with the control group, the expression abundance of hsa-miR-375-3p in the exosome of the TCPT treatment group was significantly increased. (C) KEGG pathway analysis of differential miRNA target genes, showing the top 14 enriched signalling pathways.
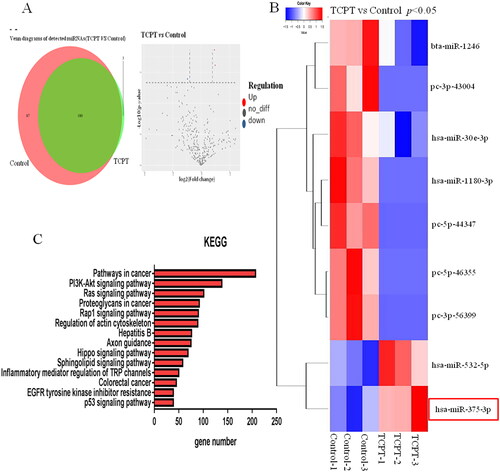
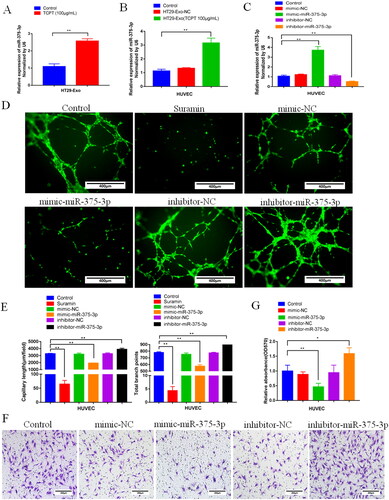
Figure 5. Exo-TCPT inhibited the angiogenic activity of HUVECs by miR-375-3P. (A) Expression of miR-375-3P in exosomes of HT-29 cells before and after TCPT treatment (n = 3), **p < 0.01 vs. control. (B) Expression of miR-375-3P in HUVECs was detected by qRT-PCR after Exo-NC and Exo-TCPT treatment (n = 3), **p < 0.01 vs. control. (C) Mimics and inhibitors of miR-375-3p were synthesized, and after transfection with HUVECs, the expression of miR-375-3p was detected (n = 3), **p < 0.01 vs. control. (D) Images of lumen formation in each group after transfection of miR-375-3p mimic and inhibitor, Bar = 250 μm. (E) The length of lumen formation and quantitative data of nodes were analysed by ImageJ (n = 3), **p < 0.01 vs. control. (F) Images of Transwell chamber experiments of miR-375-3p mimic and inhibitor, Bar = 200 μm. (G) Quantitative data analysis of the OD value of HUVEC migrating cells (n = 3), *p < 0.05, **p < 0.01 – control.
Data availability statement
All data and related information were included in this published paper, which could be acquired in the figures. Data of this study are available by the authors, without undue reservation.